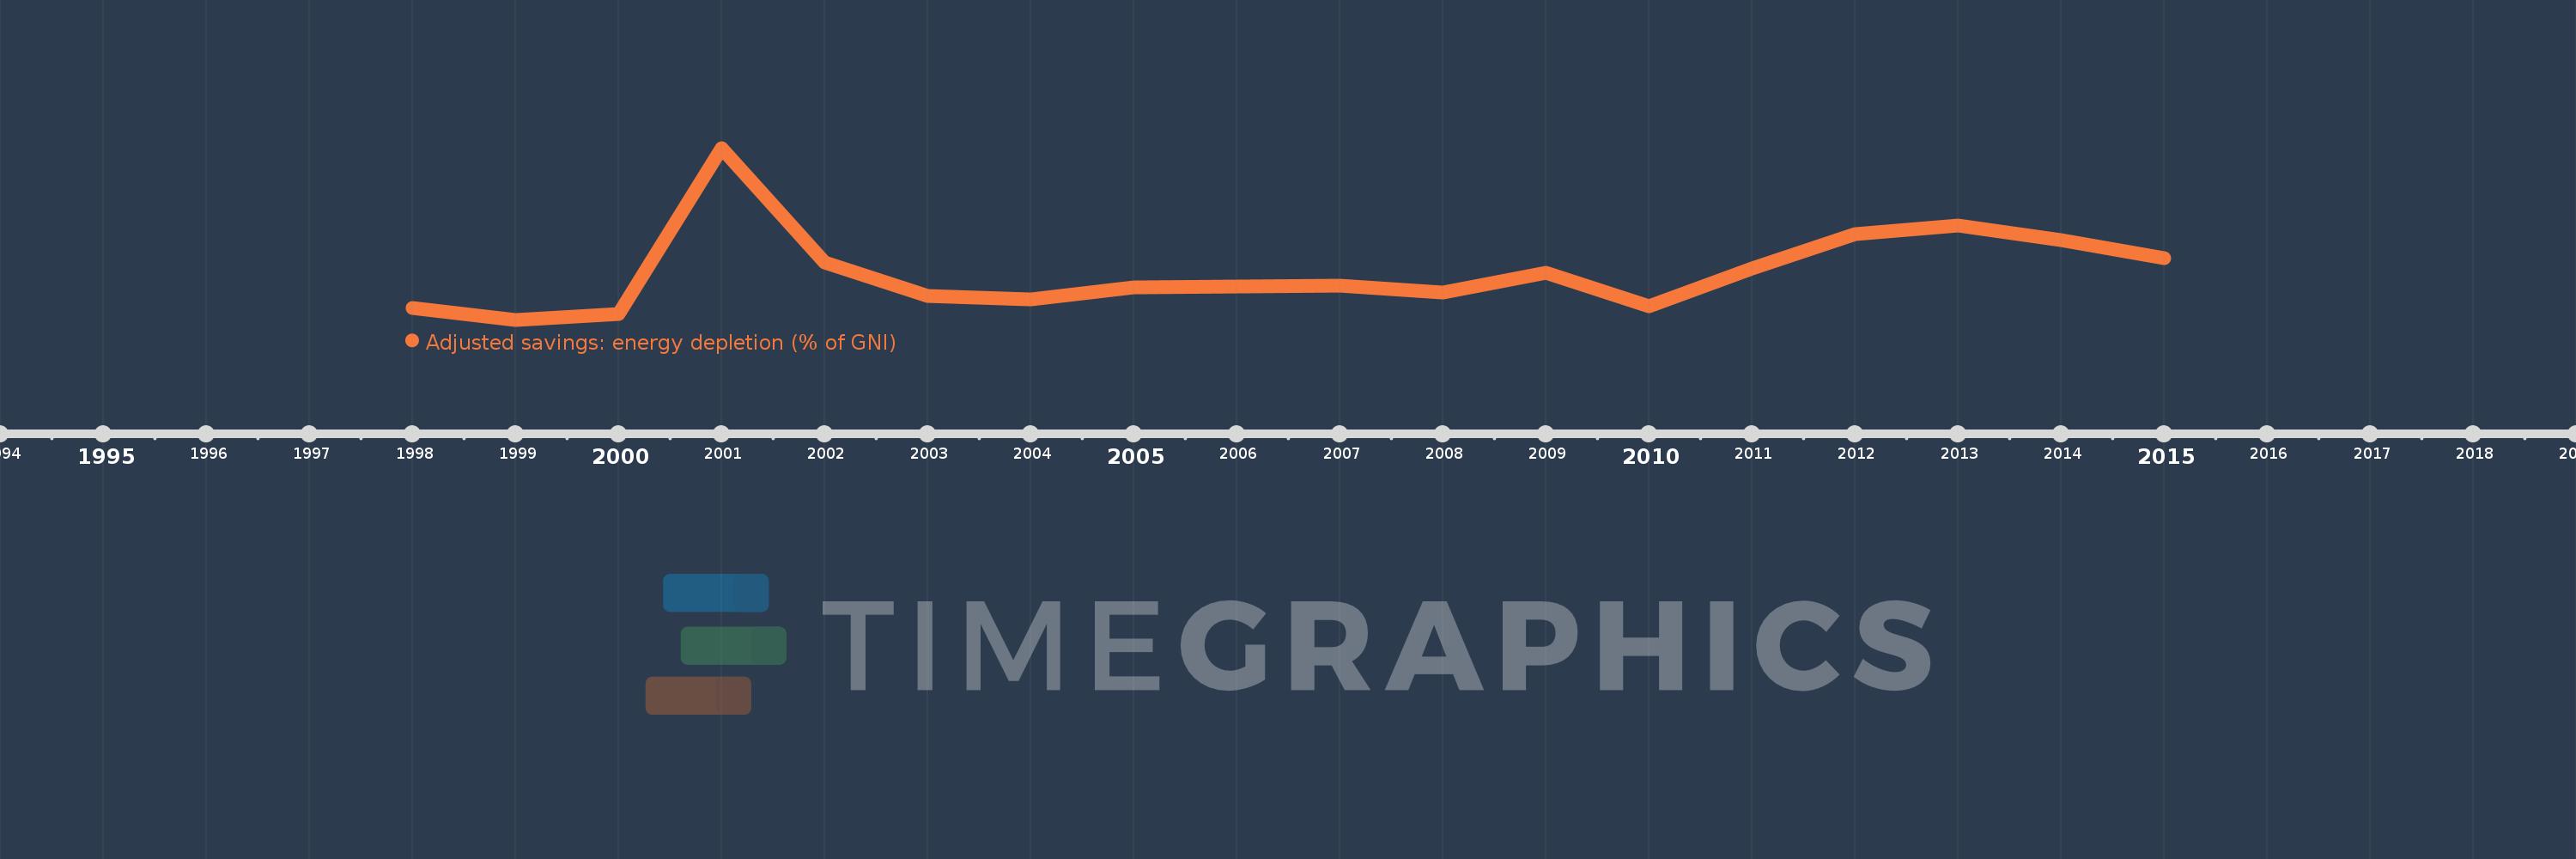
This timeline shows a graph from 1998 to 2015 of Serbia. No data until 1997. Number of actual observations by date: 18.
Source name:
World Development Indicators
Source organization:
World Bank staff estimates based on sources and methods in World Bank's "The Changing Wealth of Nations: Measuring Sustainable Development in the New Millennium" (2011).
Categories, topics:
Economy & Growth, Energy & Mining, Environment
Last updated:
apr 23, 2017
Indicators value changes by year
Meaning:
1.103
Minimum:
0.426
jan 1, 1999
Maximum:
2.886
jan 1, 2001
At the date of observation
Value
Absolute change
Change from the previous value
jan 1, 1998
0.595
+0.595
0.0%
jan 1, 1999
0.426
-0.169
-28.39%
jan 1, 2000
0.513
+0.087
20.47%
jan 1, 2001
2.886
+2.372
462.03%
jan 1, 2002
1.249
-1.637
-56.71%
jan 1, 2003
0.766
-0.484
-38.7%
jan 1, 2004
0.712
-0.054
-7.03%
jan 1, 2005
0.895
+0.183
25.71%
jan 1, 2006
0.896
+0.001
0.07%
jan 1, 2007
0.918
+0.023
2.51%
jan 1, 2008
0.813
-0.105
-11.45%
jan 1, 2009
1.1
+0.287
35.33%
jan 1, 2010
0.613
-0.487
-44.27%
jan 1, 2011
1.157
+0.544
88.65%
jan 1, 2012
1.656
+0.5
43.19%
jan 1, 2013
1.781
+0.124
7.5%
jan 1, 2014
1.567
-0.213
-11.98%
jan 1, 2015
1.304
-0.264
-16.83%
Ranking of countries by current statistics by years