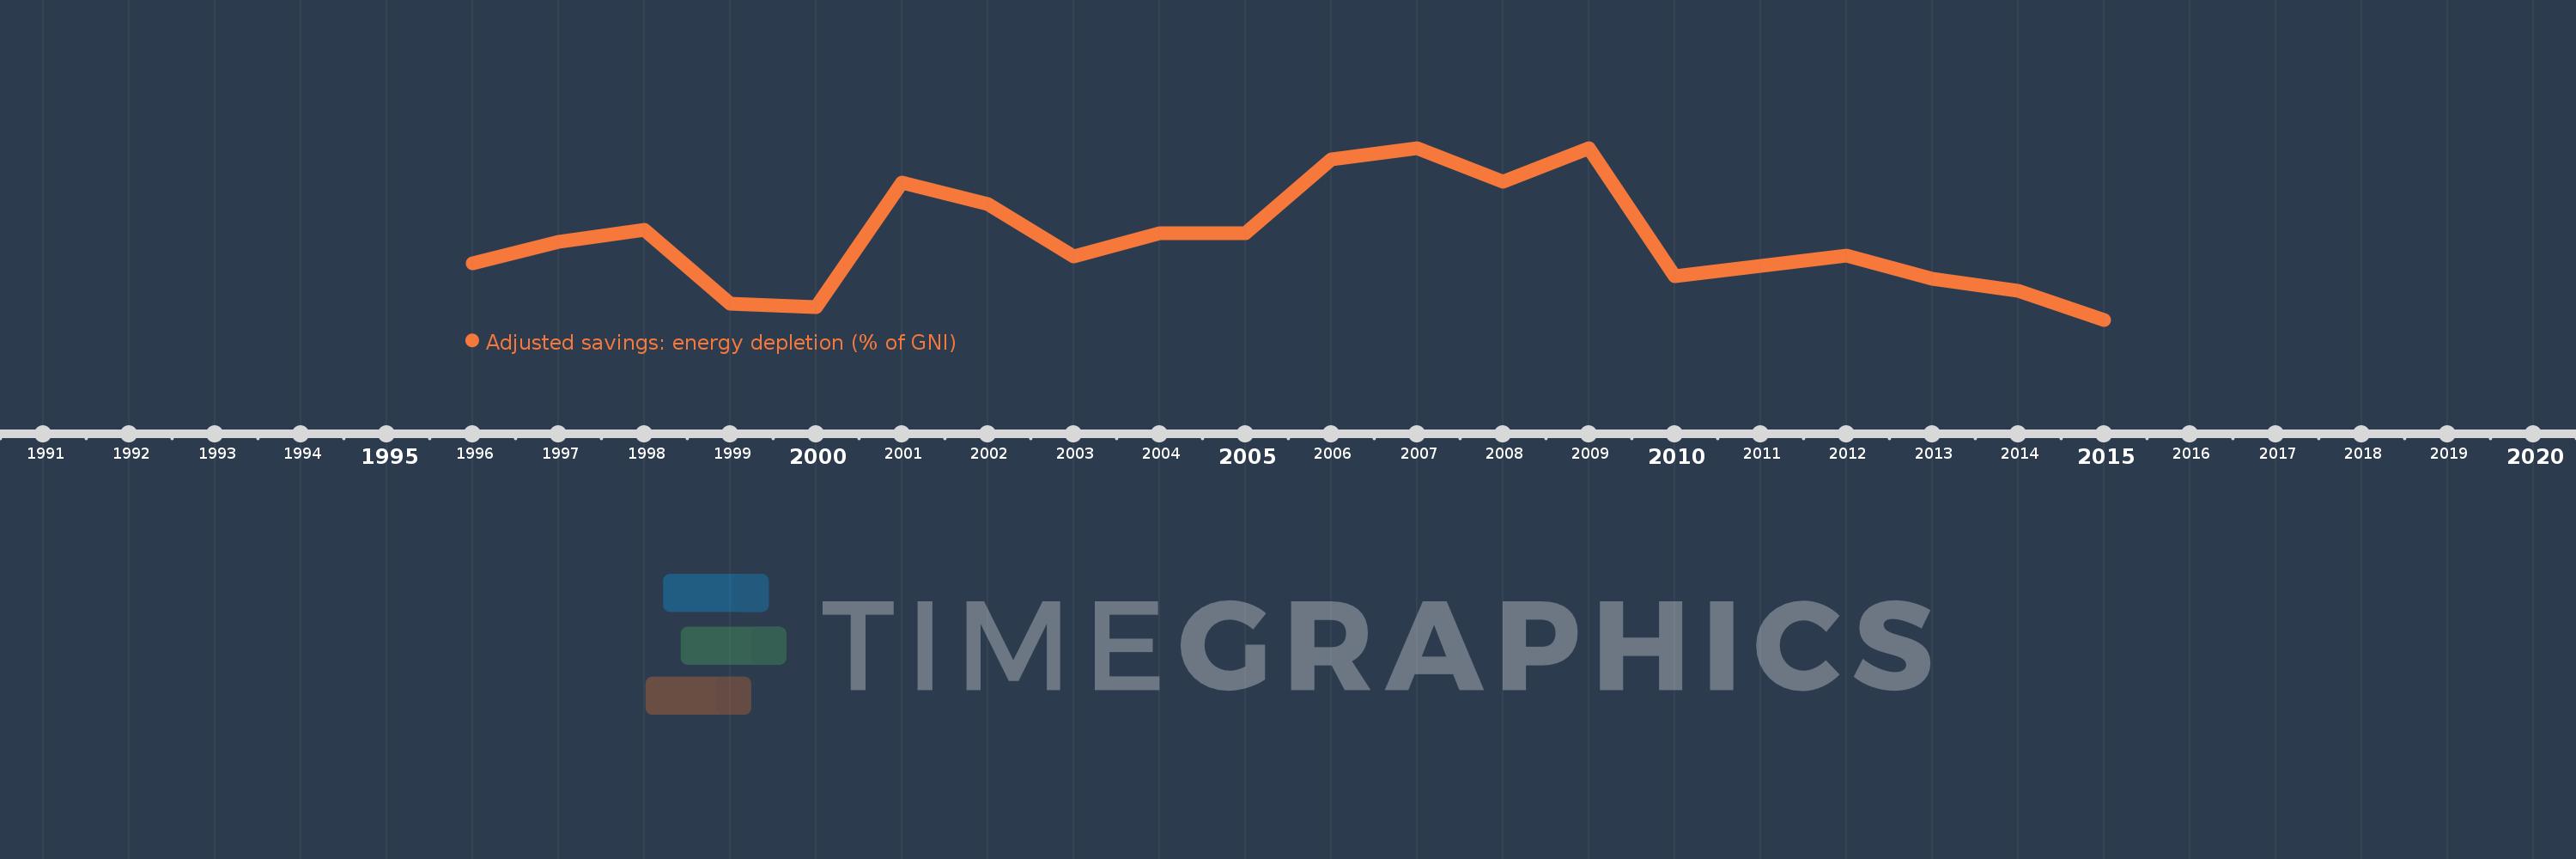
This timeline shows a graph from 1996 to 2015 of Croatia. No data until 1995. Number of actual observations by date: 20.
Source name:
World Development Indicators
Source organization:
World Bank staff estimates based on sources and methods in World Bank's "The Changing Wealth of Nations: Measuring Sustainable Development in the New Millennium" (2011).
Categories, topics:
Economy & Growth, Energy & Mining, Environment
Last updated:
apr 23, 2017
Indicators value changes by year
Meaning:
0.98
Minimum:
0.499
jan 1, 2015
Maximum:
1.521
jan 1, 2007
At the date of observation
Value
Absolute change
Change from the previous value
jan 1, 1996
0.837
+0.837
0.0%
jan 1, 1997
0.964
+0.127
15.21%
jan 1, 1998
1.032
+0.068
7.0%
jan 1, 1999
0.597
-0.435
-42.18%
jan 1, 2000
0.574
-0.022
-3.74%
jan 1, 2001
1.314
+0.74
128.81%
jan 1, 2002
1.185
-0.129
-9.85%
jan 1, 2003
0.875
-0.31
-26.18%
jan 1, 2004
1.013
+0.139
15.85%
jan 1, 2005
1.013
0.0
-0.03%
jan 1, 2006
1.452
+0.44
43.39%
jan 1, 2007
1.521
+0.069
4.75%
jan 1, 2008
1.322
-0.2
-13.13%
jan 1, 2009
1.519
+0.197
14.94%
jan 1, 2010
0.76
-0.76
-50.0%
jan 1, 2011
0.821
+0.061
8.04%
jan 1, 2012
0.88
+0.059
7.21%
jan 1, 2013
0.742
-0.138
-15.64%
jan 1, 2014
0.673
-0.069
-9.26%
jan 1, 2015
0.499
-0.174
-25.83%
Ranking of countries by current statistics by years