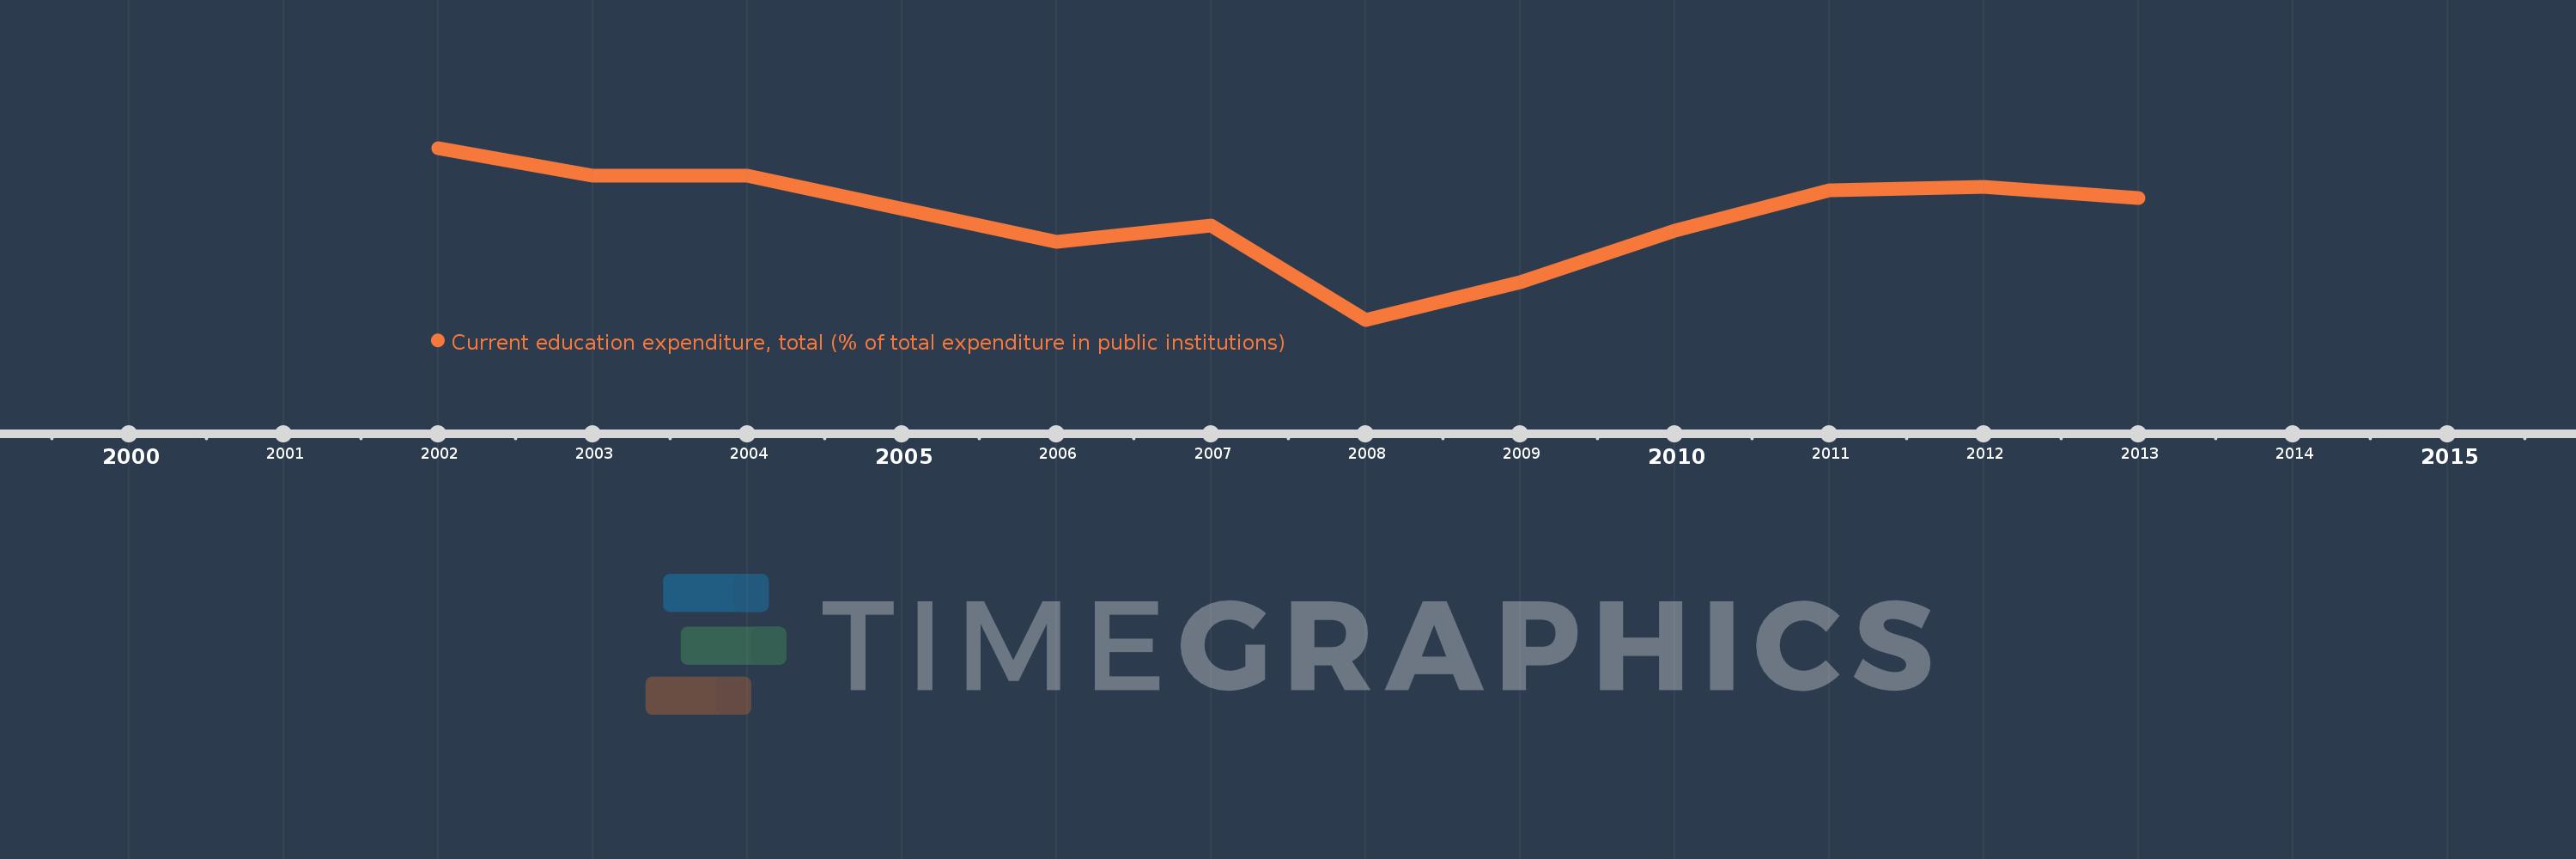
Questa scala temporale mostra un grafico dal 2002 anno al 2013 anno. Bulgaria. I dati fino ad 2001 anno non disponibili. Il numero di osservazioni attuali secondo i date: 11.
La fonte (nome):
Indicatori dello sviluppo mondiale
La fonte (organizzazione):
United Nations Educational, Scientific, and Cultural Organization (UNESCO) Institute for Statistics.
Categorie:
Education
sono stati aggiornati
23 apr 2017 anni
Indicatori delle variazioni dei valori per anni
In media:
92.428
Minima:
82.408
1 gen 2008 anni
Massimo:
98.979
1 gen 2002 anni
Alla data di osservazione
Valore
Variazione assoluta
La variazione rispetto al valore precedente
1 gen 2002 anni
98.979
+98.979
0.0%
1 gen 2003 anni
96.286
-2.693
-2.72%
1 gen 2004 anni
96.323
+0.037
0.04%
1 gen 2006 anni
89.89
-6.434
-6.68%
1 gen 2007 anni
91.5
+1.61
1.79%
1 gen 2008 anni
82.408
-9.092
-9.94%
1 gen 2009 anni
86.028
+3.62
4.39%
1 gen 2010 anni
90.998
+4.97
5.78%
1 gen 2011 anni
94.931
+3.933
4.32%
1 gen 2012 anni
95.229
+0.297
0.31%
1 gen 2013 anni
94.138
-1.09
-1.14%
Classificazione dei paesi secondo i statistiche attuali per anni