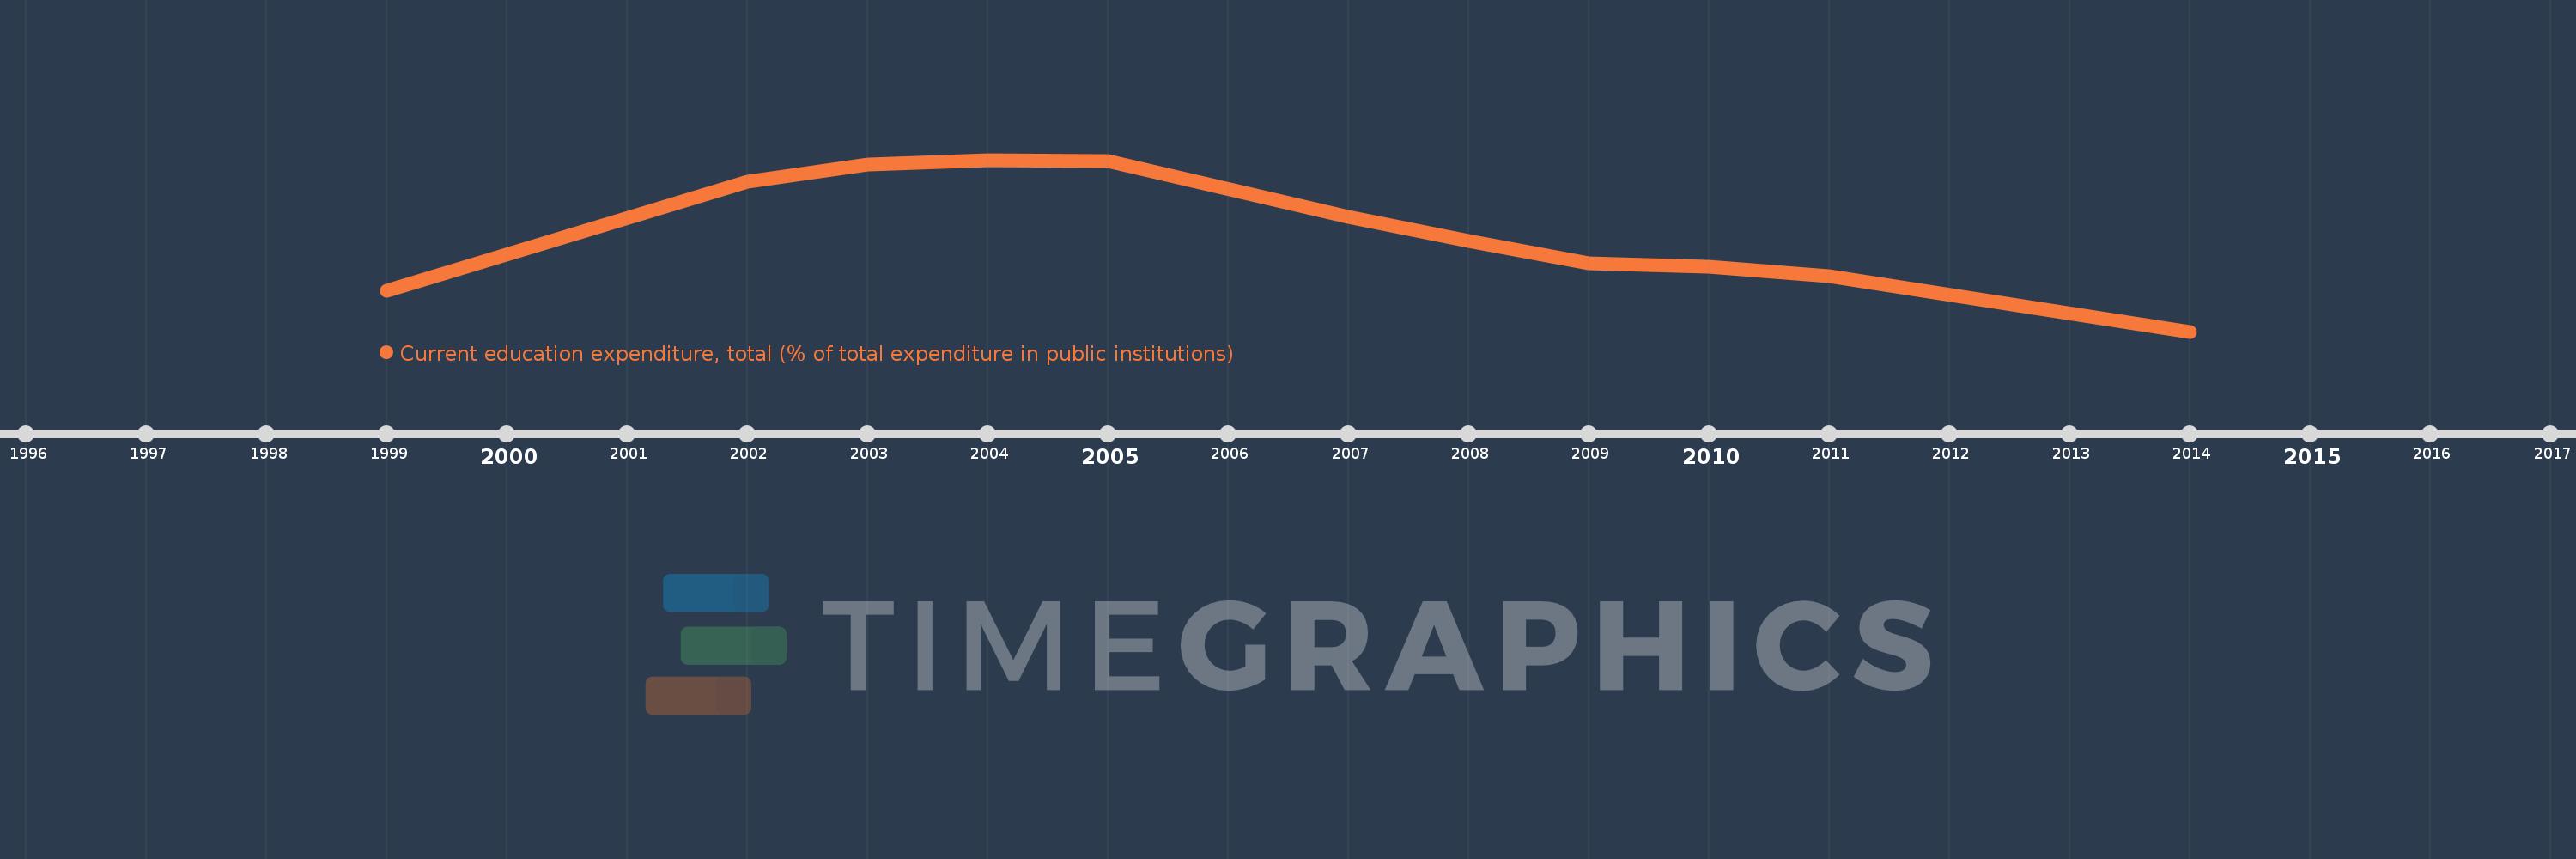
Questa scala temporale mostra un grafico dal 1999 anno al 2014 anno. Argentina. I dati fino ad 1998 anno non disponibili. Il numero di osservazioni attuali secondo i date: 11.
La fonte (nome):
Indicatori dello sviluppo mondiale
La fonte (organizzazione):
United Nations Educational, Scientific, and Cultural Organization (UNESCO) Institute for Statistics.
Categorie:
Education
sono stati aggiornati
23 apr 2017 anni
Indicatori delle variazioni dei valori per anni
In media:
97.065
Minima:
94.146
1 gen 2014 anni
Massimo:
99.188
1 gen 2004 anni
Alla data di osservazione
Valore
Variazione assoluta
La variazione rispetto al valore precedente
1 gen 1999 anni
95.343
+95.343
0.0%
1 gen 2002 anni
98.535
+3.192
3.35%
1 gen 2003 anni
99.061
+0.525
0.53%
1 gen 2004 anni
99.188
+0.127
0.13%
1 gen 2005 anni
99.158
-0.03
-0.03%
1 gen 2007 anni
97.513
-1.644
-1.66%
1 gen 2008 anni
96.794
-0.72
-0.74%
1 gen 2009 anni
96.147
-0.647
-0.67%
1 gen 2010 anni
96.05
-0.098
-0.1%
1 gen 2011 anni
95.781
-0.269
-0.28%
1 gen 2014 anni
94.146
-1.634
-1.71%
Classificazione dei paesi secondo i statistiche attuali per anni