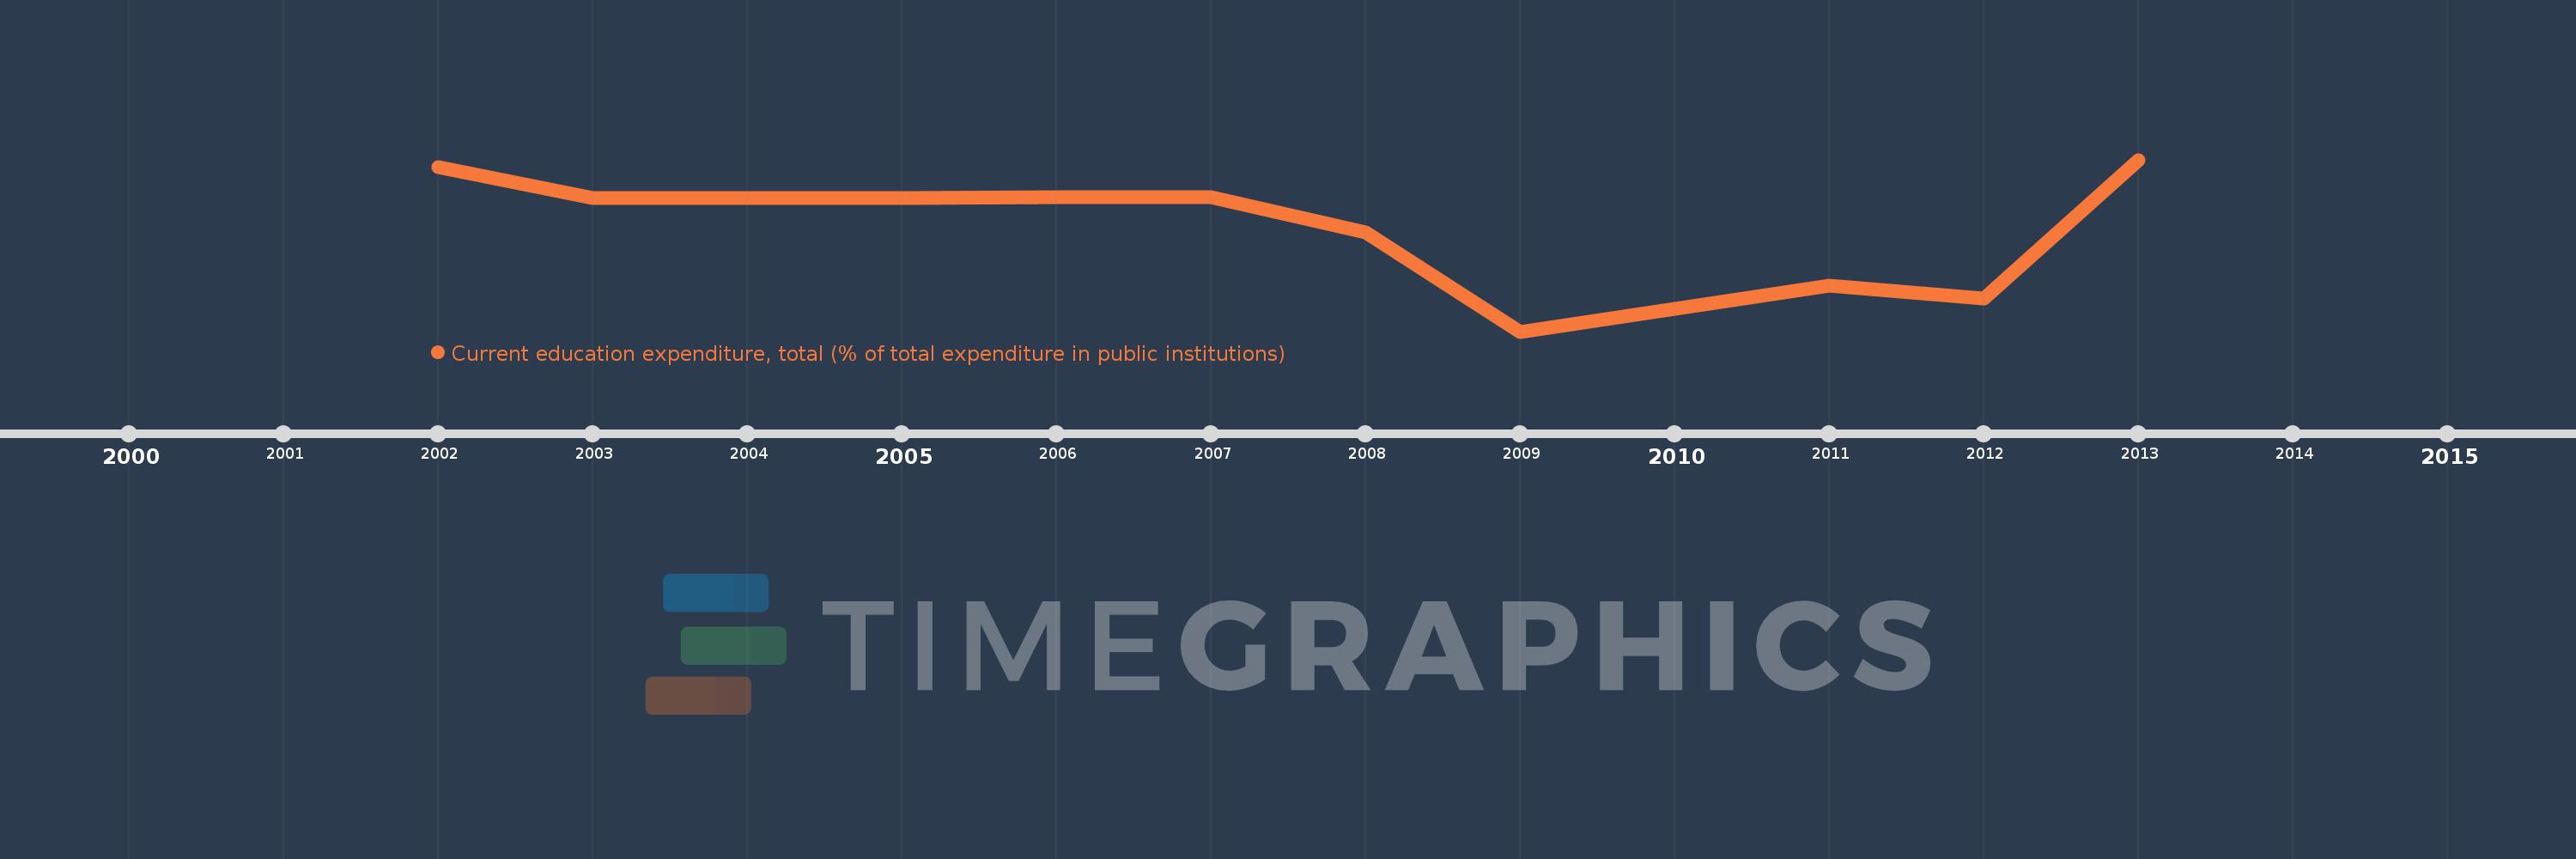
Questa scala temporale mostra un grafico dal 2002 anno al 2013 anno. Lebanon. I dati fino ad 2001 anno non disponibili. Il numero di osservazioni attuali secondo i date: 10.
La fonte (nome):
Indicatori dello sviluppo mondiale
La fonte (organizzazione):
United Nations Educational, Scientific, and Cultural Organization (UNESCO) Institute for Statistics.
Categorie:
Education
sono stati aggiornati
23 apr 2017 anni
Indicatori delle variazioni dei valori per anni
In media:
93.613
Minima:
83.816
1 gen 2009 anni
Massimo:
99.818
1 gen 2013 anni
Alla data di osservazione
Valore
Variazione assoluta
La variazione rispetto al valore precedente
1 gen 2002 anni
99.148
+99.148
0.0%
1 gen 2003 anni
96.292
-2.856
-2.88%
1 gen 2005 anni
96.287
-0.005
-0.01%
1 gen 2006 anni
96.318
+0.03
0.03%
1 gen 2007 anni
96.367
+0.049
0.05%
1 gen 2008 anni
93.06
-3.306
-3.43%
1 gen 2009 anni
83.816
-9.244
-9.93%
1 gen 2011 anni
88.089
+4.272
5.1%
1 gen 2012 anni
86.932
-1.156
-1.31%
1 gen 2013 anni
99.818
+12.886
14.82%
Classificazione dei paesi secondo i statistiche attuali per anni