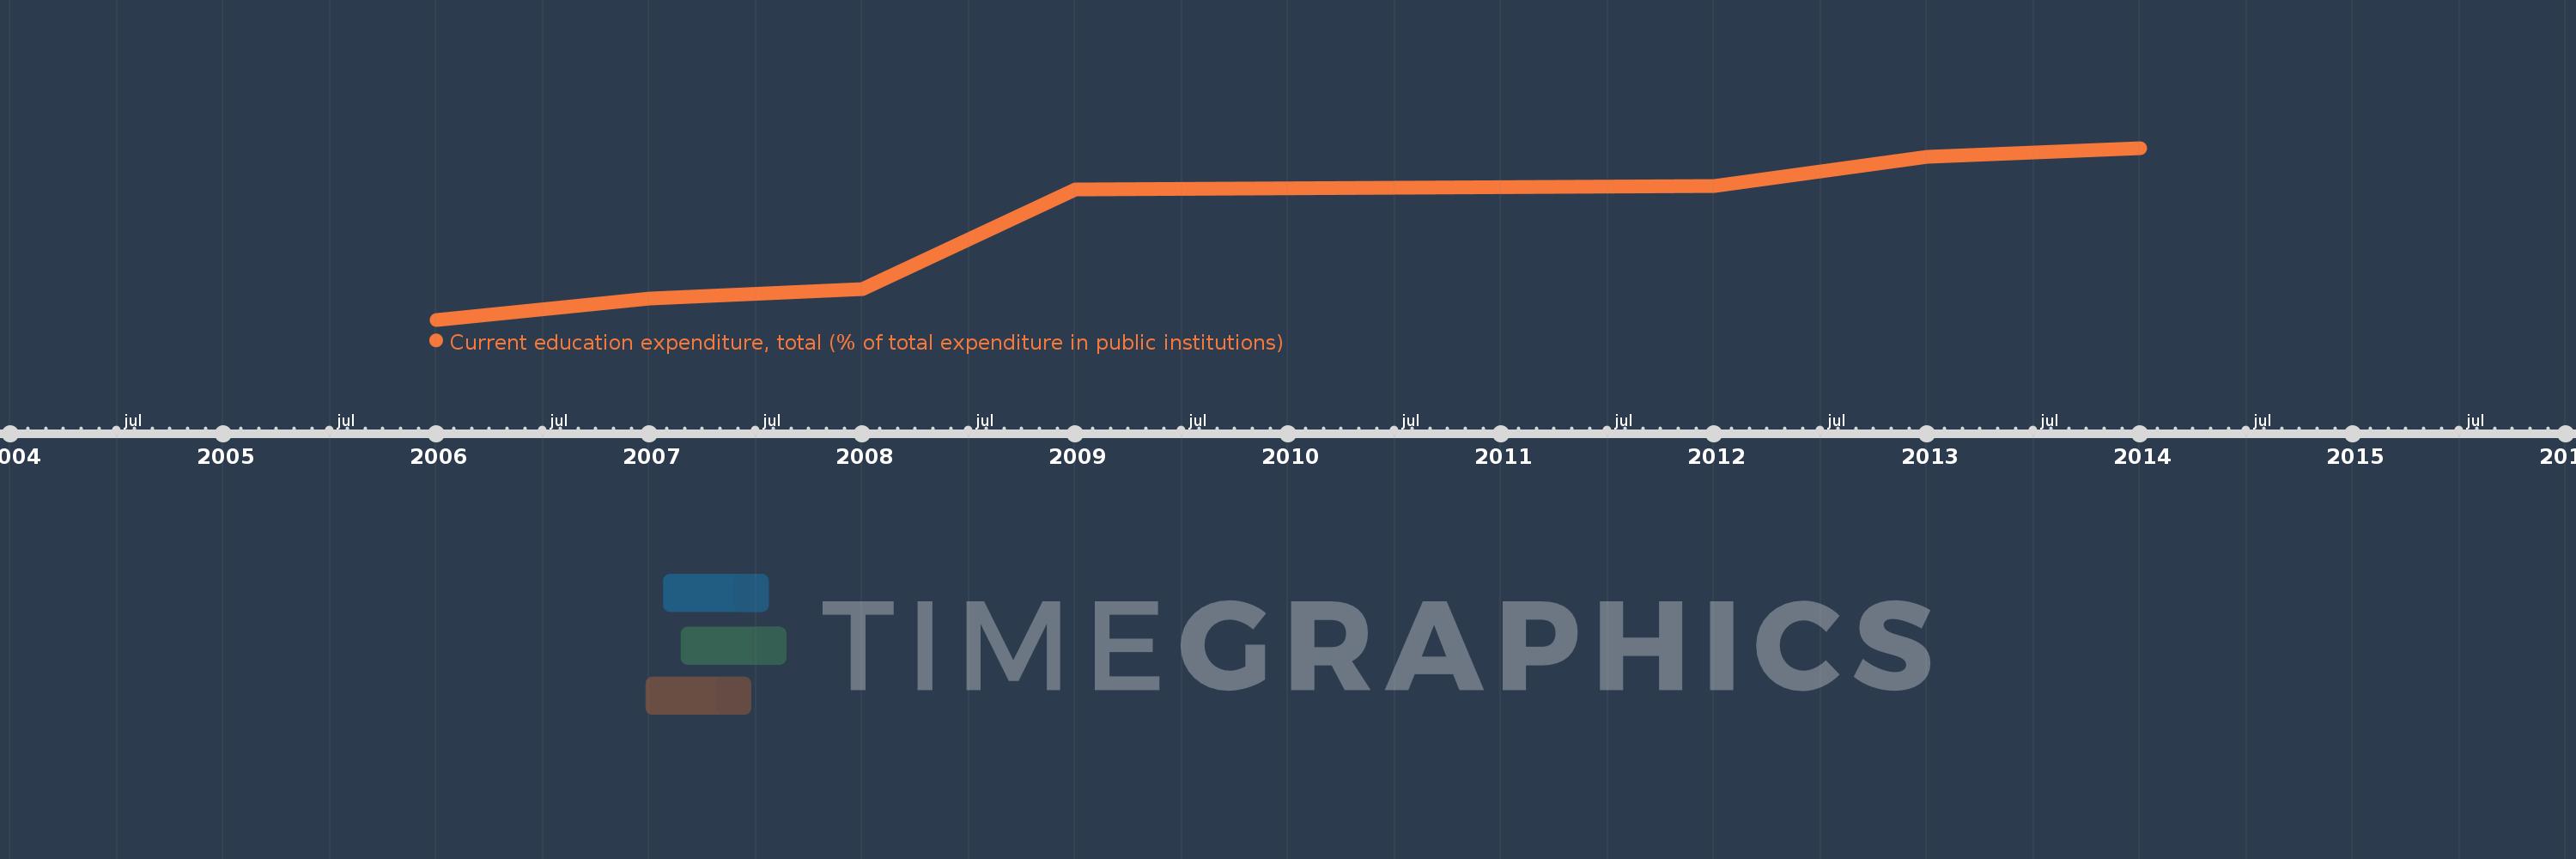
Questa scala temporale mostra un grafico dal 2006 anno al 2014 anno. Madagascar. I dati fino ad 2005 anno non disponibili. Il numero di osservazioni attuali secondo i date: 7.
La fonte (nome):
Indicatori dello sviluppo mondiale
La fonte (organizzazione):
United Nations Educational, Scientific, and Cultural Organization (UNESCO) Institute for Statistics.
Categorie:
Education
sono stati aggiornati
23 apr 2017 anni
Indicatori delle variazioni dei valori per anni
In media:
83.756
Minima:
68.222
1 gen 2006 anni
Massimo:
96.925
1 gen 2014 anni
Alla data di osservazione
Valore
Variazione assoluta
La variazione rispetto al valore precedente
1 gen 2006 anni
68.222
+68.222
0.0%
1 gen 2007 anni
71.832
+3.609
5.29%
1 gen 2008 anni
73.3
+1.468
2.04%
1 gen 2009 anni
89.973
+16.673
22.75%
1 gen 2012 anni
90.627
+0.654
0.73%
1 gen 2013 anni
95.412
+4.785
5.28%
1 gen 2014 anni
96.925
+1.513
1.59%
Classificazione dei paesi secondo i statistiche attuali per anni