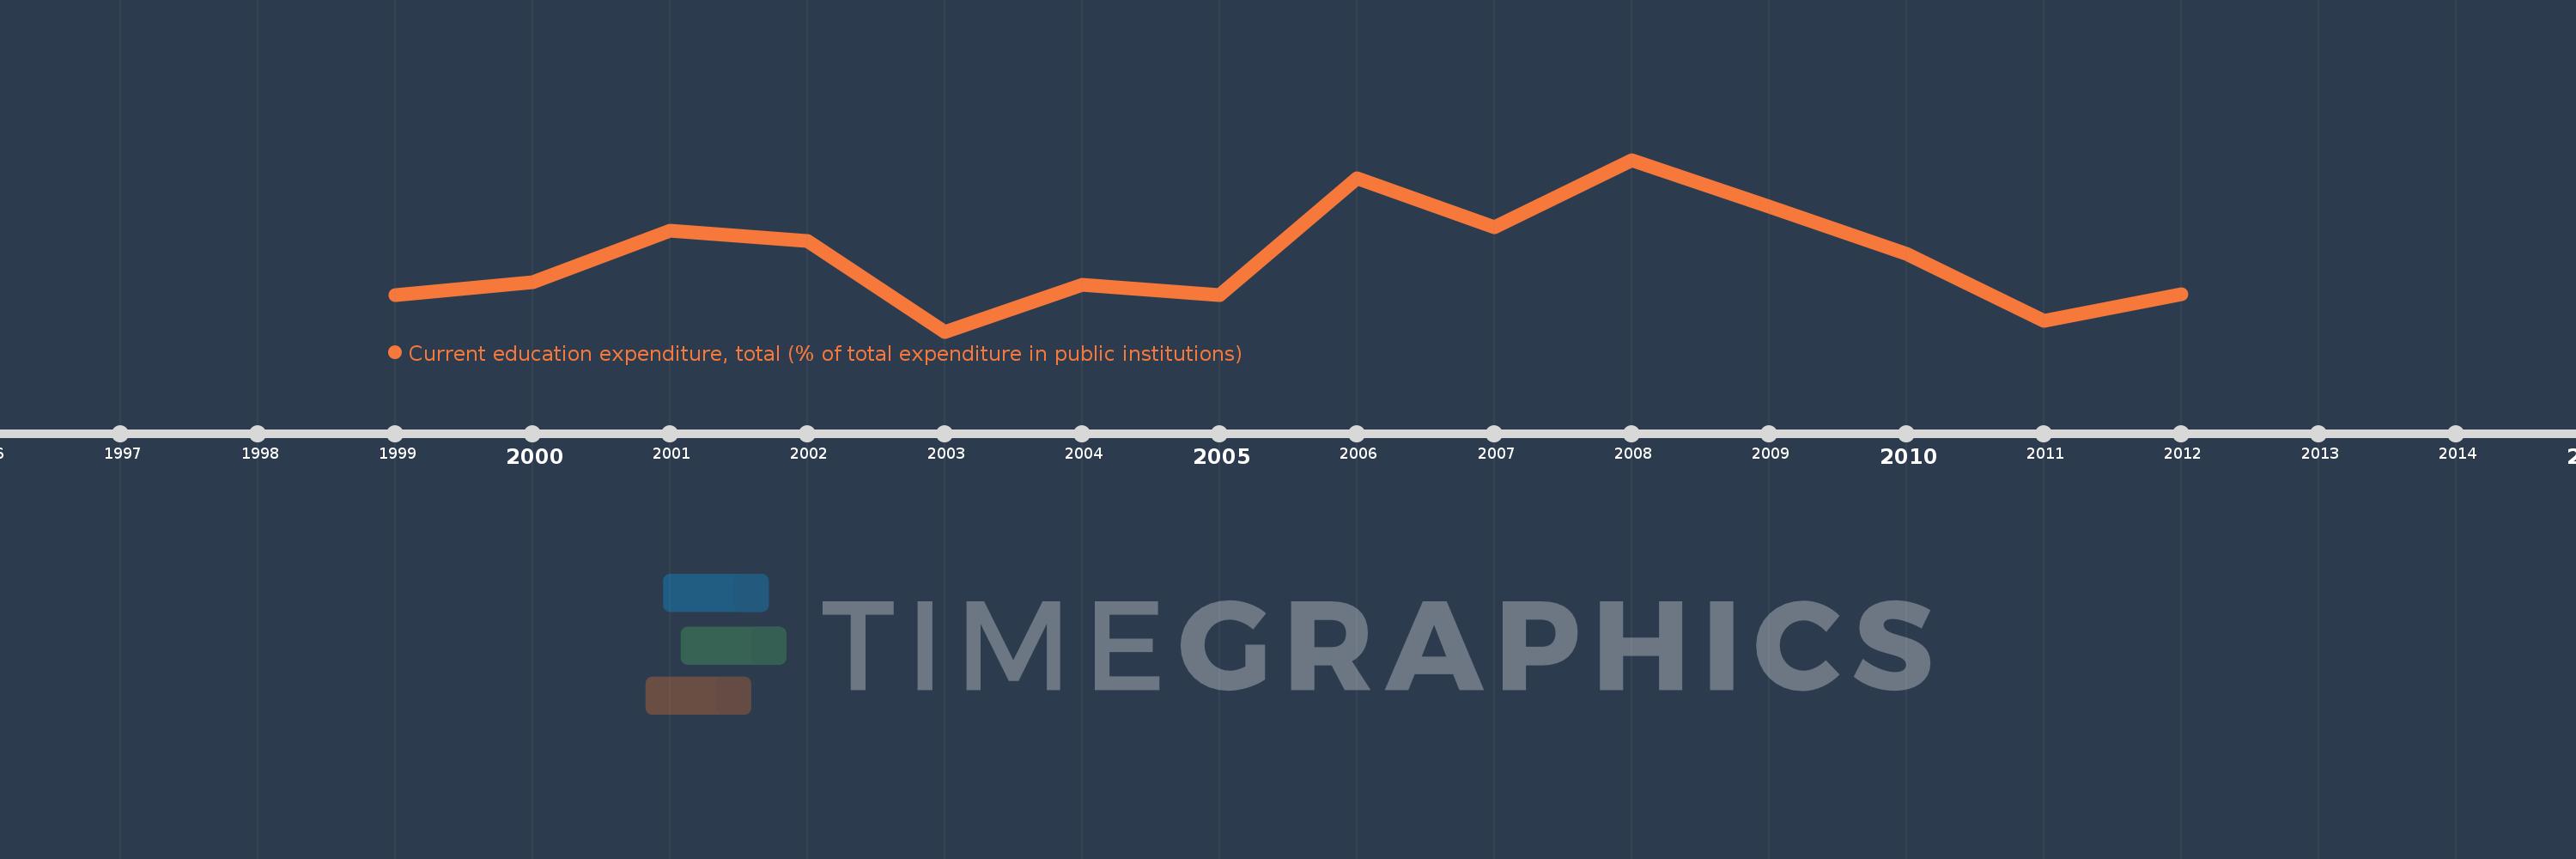
Questa scala temporale mostra un grafico dal 1999 anno al 2012 anno. OECD members. I dati fino ad 1998 anno non disponibili. Il numero di osservazioni attuali secondo i date: 14.
La fonte (nome):
Indicatori dello sviluppo mondiale
La fonte (organizzazione):
United Nations Educational, Scientific, and Cultural Organization (UNESCO) Institute for Statistics.
Categorie:
Education
sono stati aggiornati
23 apr 2017 anni
Indicatori delle variazioni dei valori per anni
In media:
91.53
Minima:
90.488
1 gen 2003 anni
Massimo:
92.891
1 gen 2008 anni
Alla data di osservazione
Valore
Variazione assoluta
La variazione rispetto al valore precedente
1 gen 1999 anni
90.999
+90.999
0.0%
1 gen 2000 anni
91.182
+0.183
0.2%
1 gen 2001 anni
91.901
+0.719
0.79%
1 gen 2002 anni
91.755
-0.146
-0.16%
1 gen 2003 anni
90.488
-1.267
-1.38%
1 gen 2004 anni
91.145
+0.657
0.73%
1 gen 2005 anni
91.004
-0.141
-0.16%
1 gen 2006 anni
92.636
+1.632
1.79%
1 gen 2007 anni
91.952
-0.684
-0.74%
1 gen 2008 anni
92.891
+0.939
1.02%
1 gen 2009 anni
92.239
-0.652
-0.7%
1 gen 2010 anni
91.577
-0.661
-0.72%
1 gen 2011 anni
90.643
-0.935
-1.02%
1 gen 2012 anni
91.013
+0.37
0.41%
Classificazione dei paesi secondo i statistiche attuali per anni