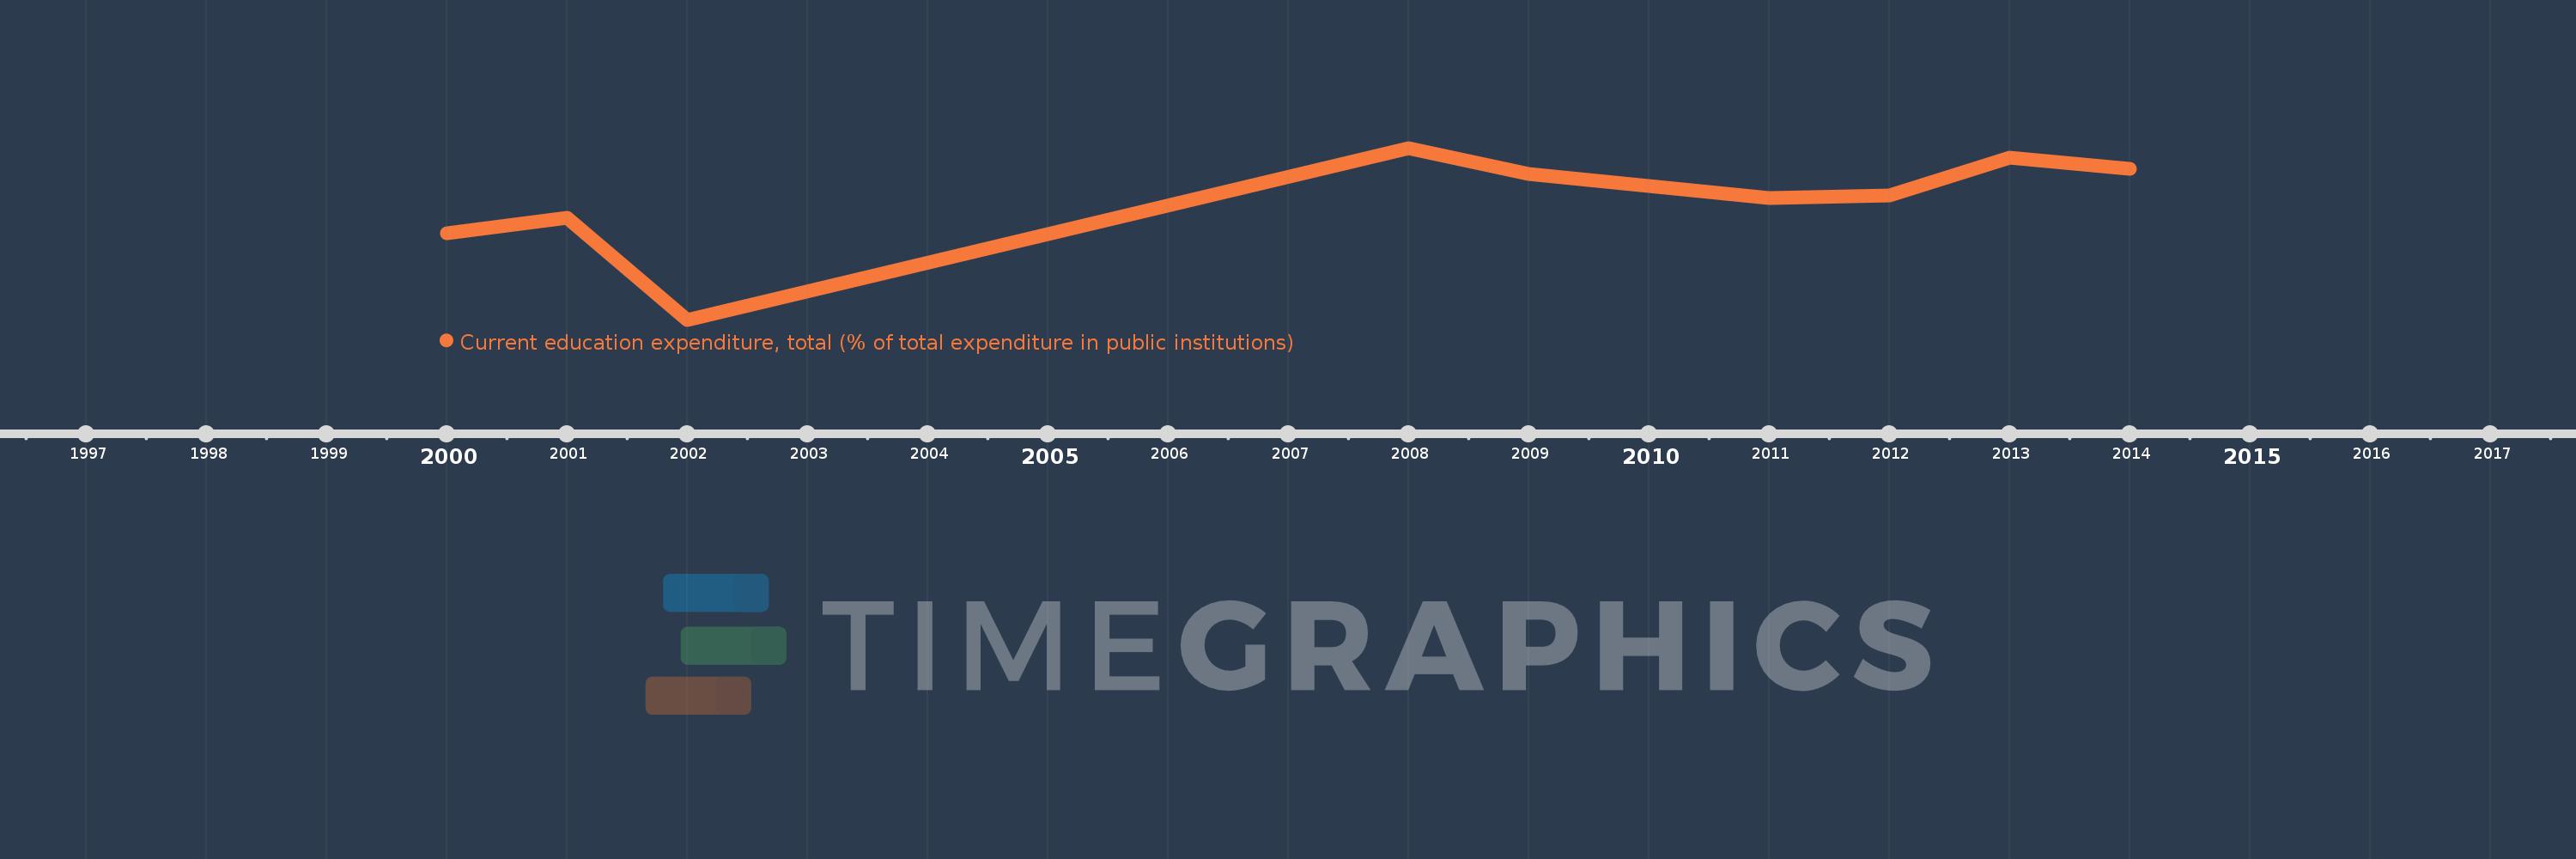
Questa scala temporale mostra un grafico dal 2000 anno al 2014 anno. Rwanda. I dati fino ad 1999 anno non disponibili. Il numero di osservazioni attuali secondo i date: 9.
La fonte (nome):
Indicatori dello sviluppo mondiale
La fonte (organizzazione):
United Nations Educational, Scientific, and Cultural Organization (UNESCO) Institute for Statistics.
Categorie:
Education
sono stati aggiornati
23 apr 2017 anni
Indicatori delle variazioni dei valori per anni
In media:
83.191
Minima:
58.238
1 gen 2002 anni
Massimo:
94.455
1 gen 2008 anni
Alla data di osservazione
Valore
Variazione assoluta
La variazione rispetto al valore precedente
1 gen 2000 anni
76.523
+76.523
0.0%
1 gen 2001 anni
79.703
+3.18
4.16%
1 gen 2002 anni
58.238
-21.465
-26.93%
1 gen 2008 anni
94.455
+36.217
62.19%
1 gen 2009 anni
88.942
-5.512
-5.84%
1 gen 2011 anni
83.876
-5.066
-5.7%
1 gen 2012 anni
84.411
+0.534
0.64%
1 gen 2013 anni
92.446
+8.036
9.52%
1 gen 2014 anni
90.125
-2.321
-2.51%
Classificazione dei paesi secondo i statistiche attuali per anni