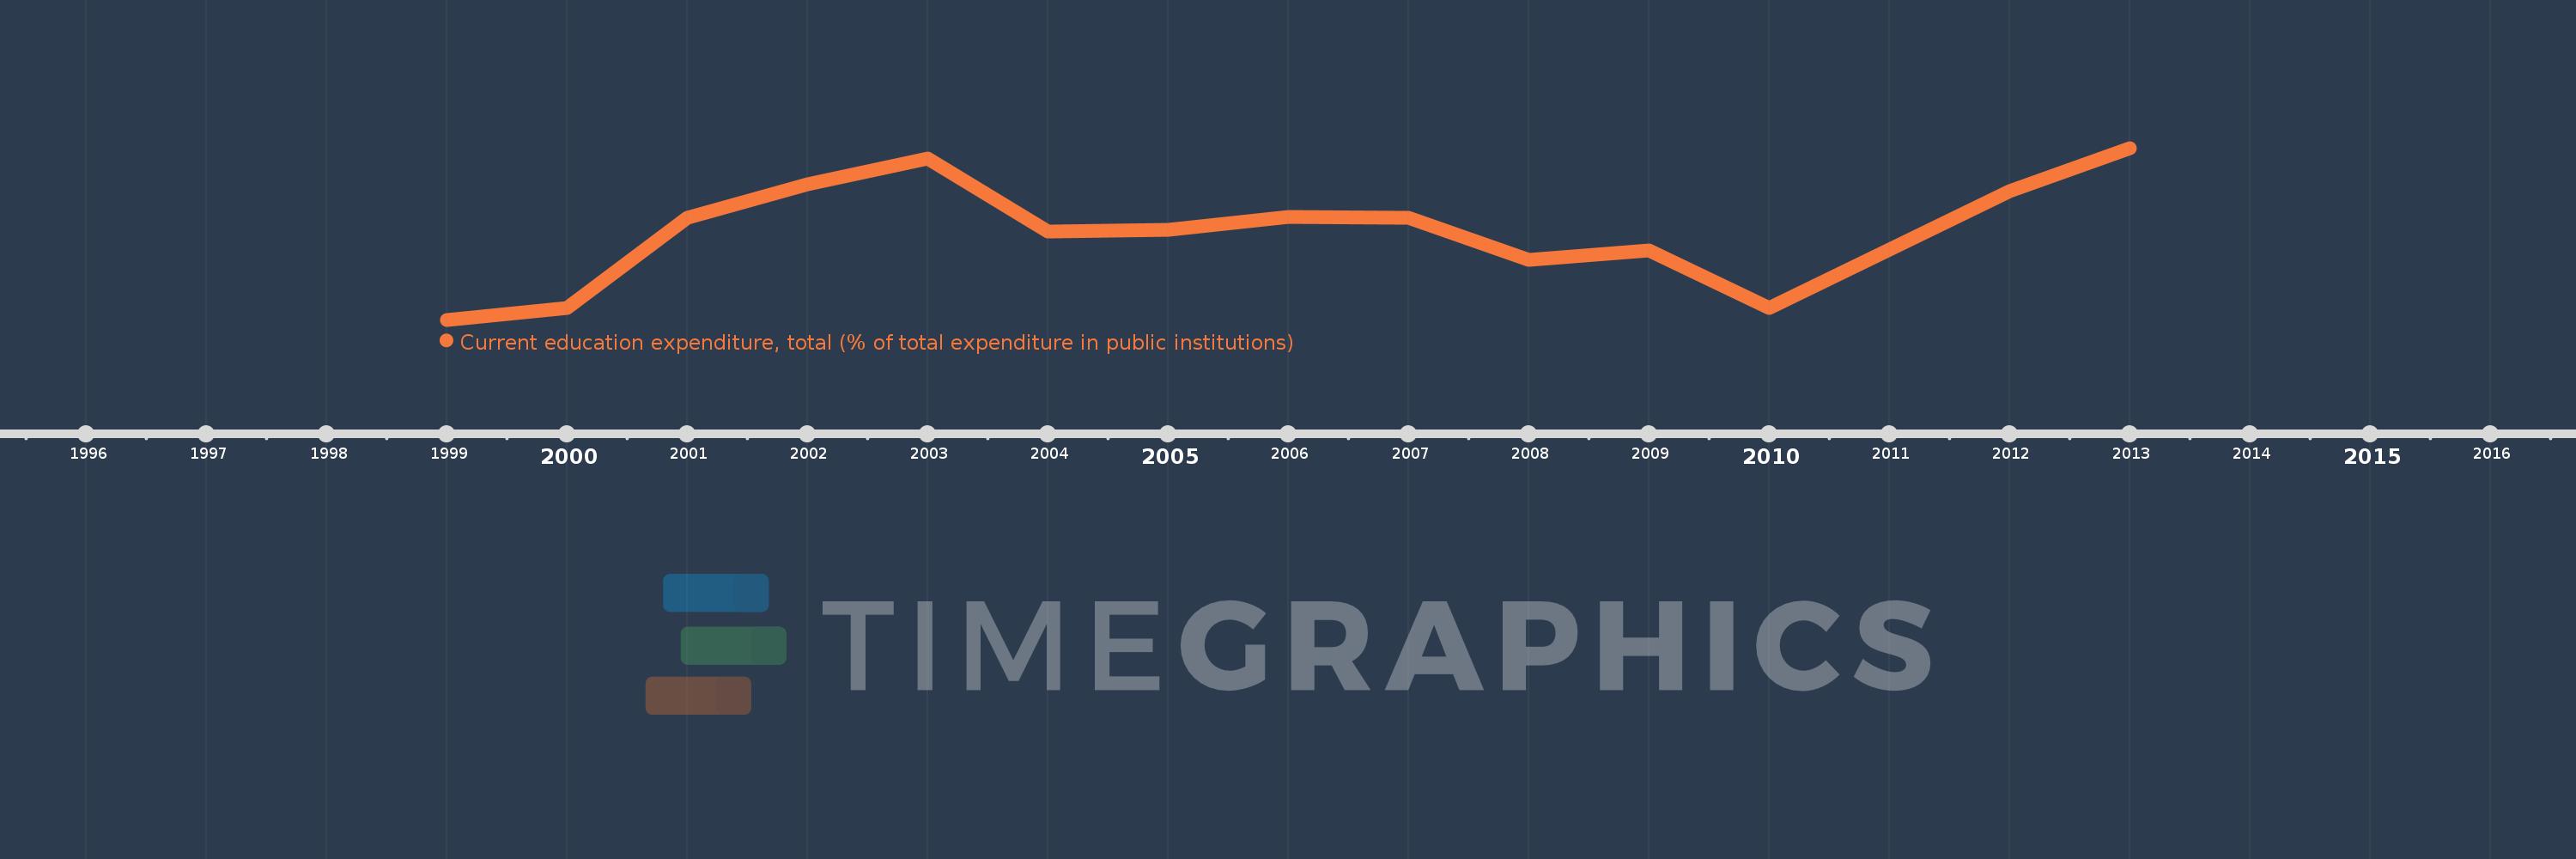
Questa scala temporale mostra un grafico dal 1999 anno al 2013 anno. Norway. I dati fino ad 1998 anno non disponibili. Il numero di osservazioni attuali secondo i date: 15.
La fonte (nome):
Indicatori dello sviluppo mondiale
La fonte (organizzazione):
United Nations Educational, Scientific, and Cultural Organization (UNESCO) Institute for Statistics.
Categorie:
Education
sono stati aggiornati
23 apr 2017 anni
Indicatori delle variazioni dei valori per anni
In media:
89.027
Minima:
87.296
1 gen 1999 anni
Massimo:
90.713
1 gen 2013 anni
Alla data di osservazione
Valore
Variazione assoluta
La variazione rispetto al valore precedente
1 gen 1999 anni
87.296
+87.296
0.0%
1 gen 2000 anni
87.532
+0.235
0.27%
1 gen 2001 anni
89.319
+1.787
2.04%
1 gen 2002 anni
89.994
+0.675
0.76%
1 gen 2003 anni
90.509
+0.515
0.57%
1 gen 2004 anni
89.056
-1.453
-1.61%
1 gen 2005 anni
89.085
+0.029
0.03%
1 gen 2006 anni
89.343
+0.258
0.29%
1 gen 2007 anni
89.326
-0.017
-0.02%
1 gen 2008 anni
88.48
-0.846
-0.95%
1 gen 2009 anni
88.674
+0.194
0.22%
1 gen 2010 anni
87.535
-1.139
-1.28%
1 gen 2011 anni
88.688
+1.153
1.32%
1 gen 2012 anni
89.858
+1.17
1.32%
1 gen 2013 anni
90.713
+0.855
0.95%
Classificazione dei paesi secondo i statistiche attuali per anni