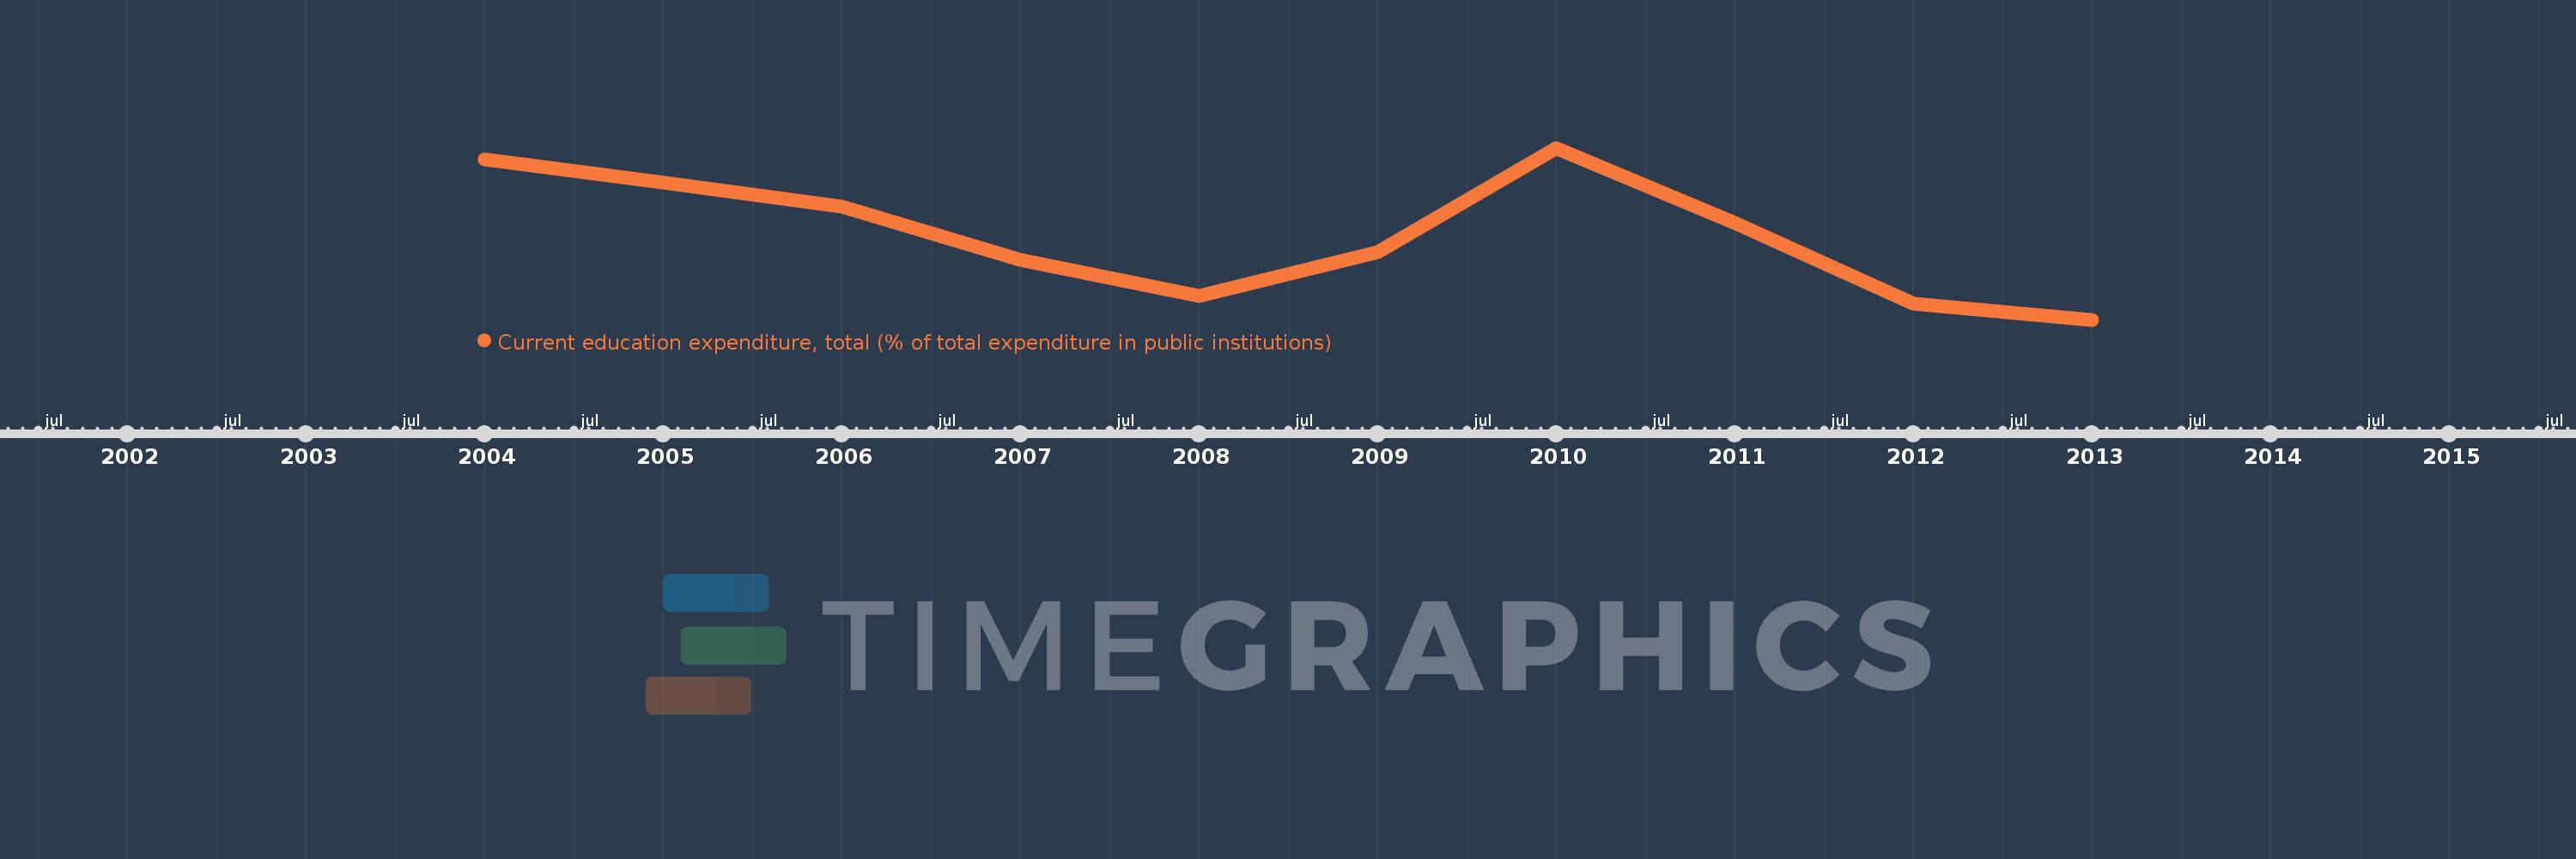
Questa scala temporale mostra un grafico dal 2004 anno al 2013 anno. Lithuania. I dati fino ad 2003 anno non disponibili. Il numero di osservazioni attuali secondo i date: 10.
La fonte (nome):
Indicatori dello sviluppo mondiale
La fonte (organizzazione):
United Nations Educational, Scientific, and Cultural Organization (UNESCO) Institute for Statistics.
Categorie:
Education
sono stati aggiornati
23 apr 2017 anni
Indicatori delle variazioni dei valori per anni
In media:
91.748
Minima:
87.522
1 gen 2013 anni
Massimo:
96.09
1 gen 2010 anni
Alla data di osservazione
Valore
Variazione assoluta
La variazione rispetto al valore precedente
1 gen 2004 anni
95.509
+95.509
0.0%
1 gen 2005 anni
94.348
-1.161
-1.22%
1 gen 2006 anni
93.156
-1.192
-1.26%
1 gen 2007 anni
90.527
-2.63
-2.82%
1 gen 2008 anni
88.702
-1.825
-2.02%
1 gen 2009 anni
90.911
+2.209
2.49%
1 gen 2010 anni
96.09
+5.18
5.7%
1 gen 2011 anni
92.371
-3.719
-3.87%
1 gen 2012 anni
88.343
-4.028
-4.36%
1 gen 2013 anni
87.522
-0.822
-0.93%
Classificazione dei paesi secondo i statistiche attuali per anni