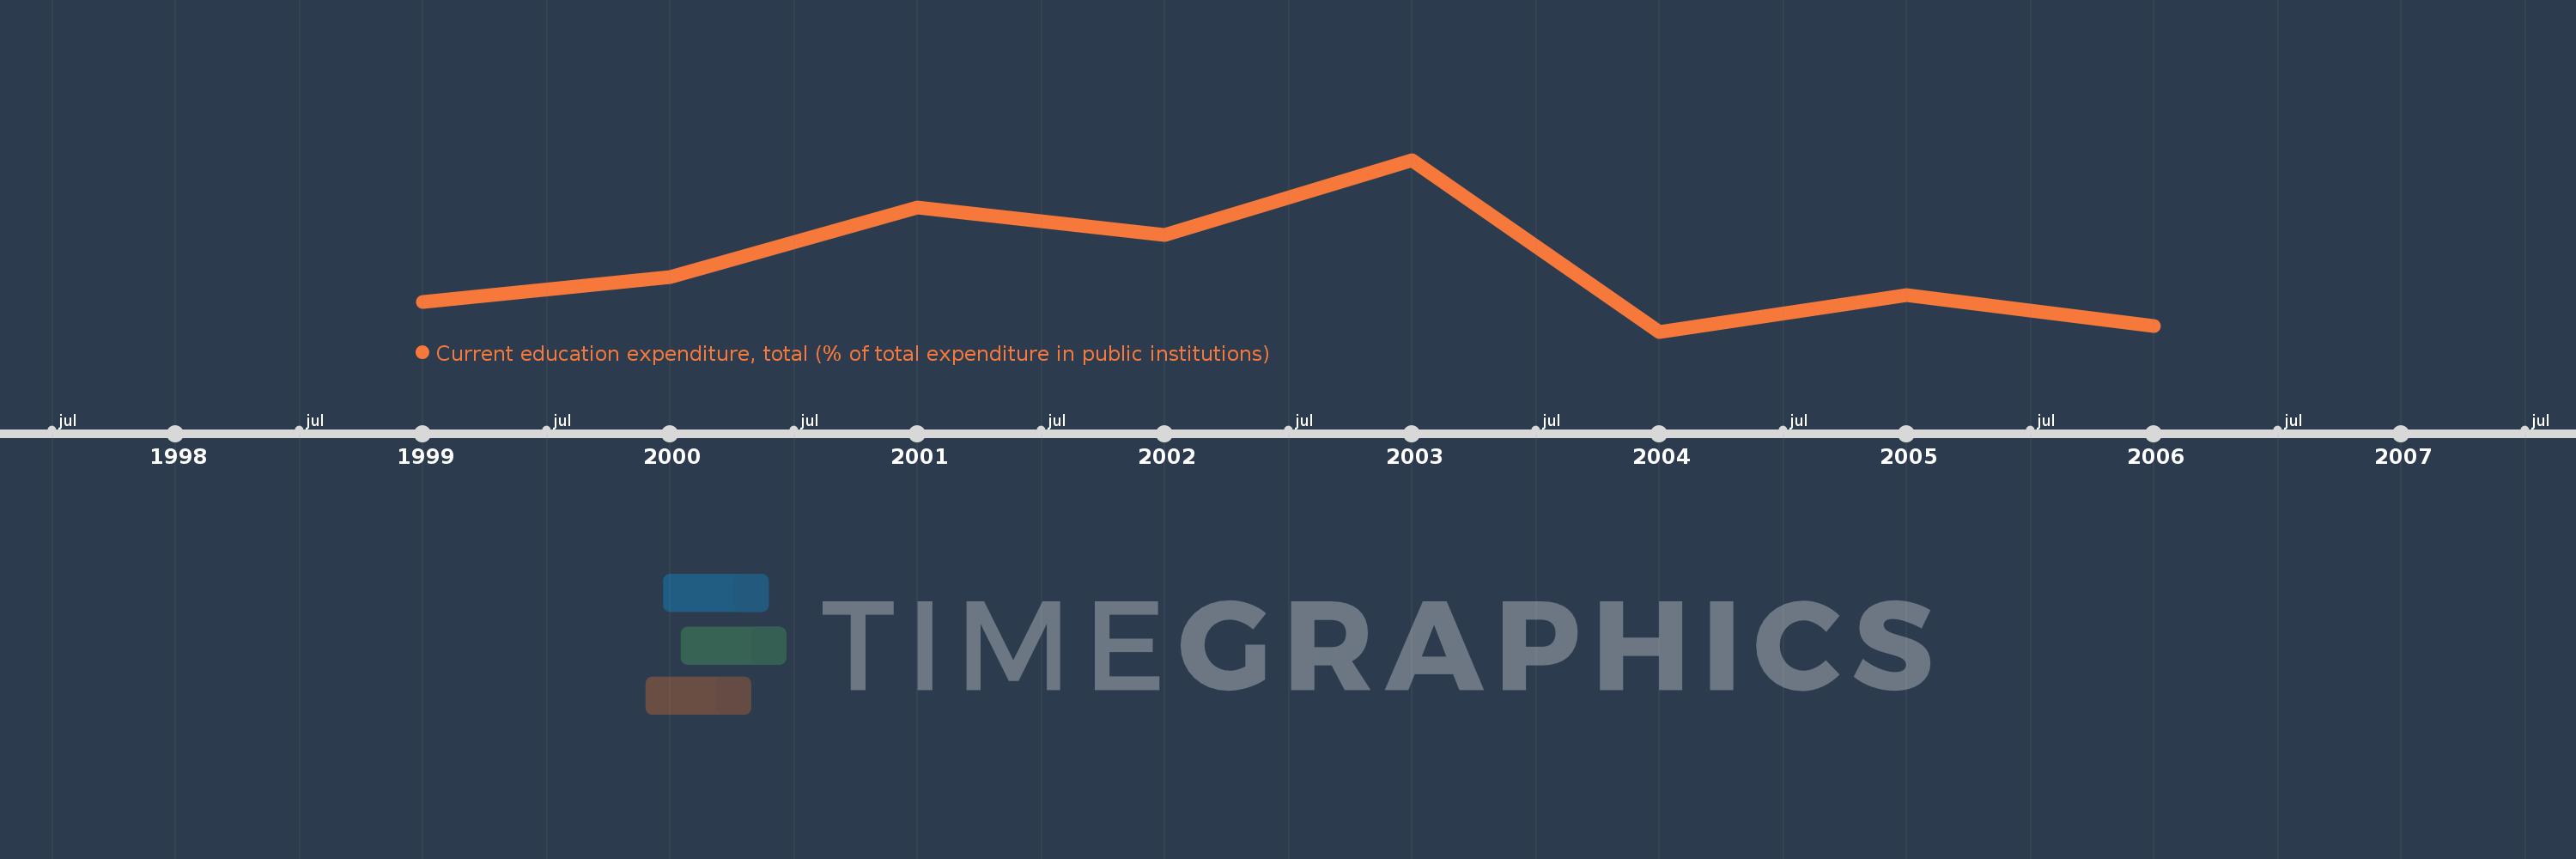
Questa scala temporale mostra un grafico dal 1999 anno al 2006 anno. Greece. I dati fino ad 1998 anno non disponibili. Il numero di osservazioni attuali secondo i date: 8.
La fonte (nome):
Indicatori dello sviluppo mondiale
La fonte (organizzazione):
United Nations Educational, Scientific, and Cultural Organization (UNESCO) Institute for Statistics.
Categorie:
Education
sono stati aggiornati
23 apr 2017 anni
Indicatori delle variazioni dei valori per anni
In media:
80.099
Minima:
78.165
1 gen 2004 anni
Massimo:
83.291
1 gen 2003 anni
Alla data di osservazione
Valore
Variazione assoluta
La variazione rispetto al valore precedente
1 gen 1999 anni
79.056
+79.056
0.0%
1 gen 2000 anni
79.79
+0.734
0.93%
1 gen 2001 anni
81.873
+2.083
2.61%
1 gen 2002 anni
81.04
-0.833
-1.02%
1 gen 2003 anni
83.291
+2.251
2.78%
1 gen 2004 anni
78.165
-5.126
-6.15%
1 gen 2005 anni
79.253
+1.088
1.39%
1 gen 2006 anni
78.321
-0.931
-1.17%
Classificazione dei paesi secondo i statistiche attuali per anni