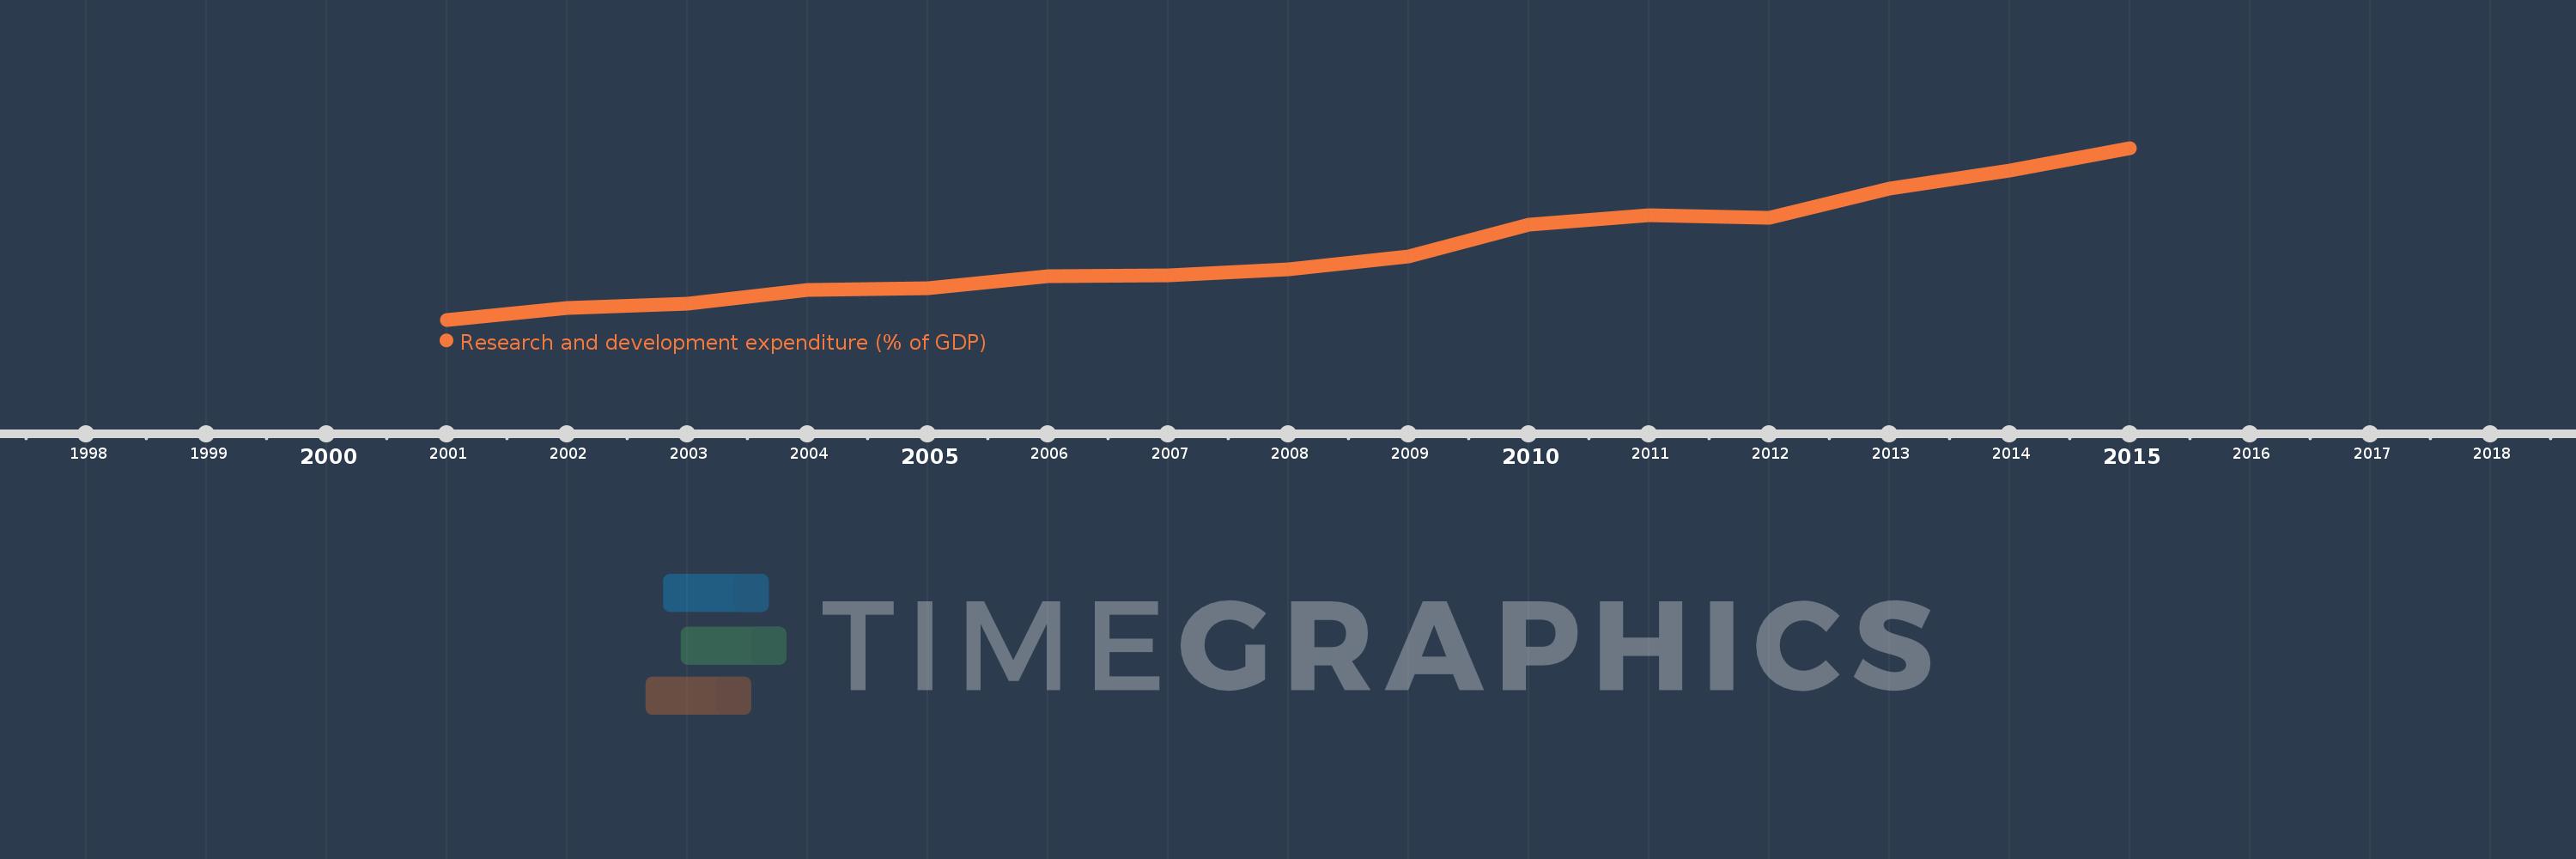
Questa scala temporale mostra un grafico dal 2001 anno al 2015 anno. Late-demographic dividend. I dati fino ad 2000 anno non disponibili. Il numero di osservazioni attuali secondo i date: 15.
La fonte (nome):
Indicatori dello sviluppo mondiale
La fonte (organizzazione):
United Nations Educational, Scientific, and Cultural Organization (UNESCO) Institute for Statistics.
Categorie:
Science & Technology
sono stati aggiornati
23 apr 2017 anni
Indicatori delle variazioni dei valori per anni
In media:
1.157
Minima:
0.816
1 gen 2001 anni
Massimo:
1.658
1 gen 2015 anni
Alla data di osservazione
Valore
Variazione assoluta
La variazione rispetto al valore precedente
1 gen 2001 anni
0.816
+0.816
0.0%
1 gen 2002 anni
0.872
+0.056
6.86%
1 gen 2003 anni
0.896
+0.024
2.79%
1 gen 2004 anni
0.96
+0.064
7.1%
1 gen 2005 anni
0.969
+0.009
0.98%
1 gen 2006 anni
1.029
+0.06
6.15%
1 gen 2007 anni
1.034
+0.005
0.53%
1 gen 2008 anni
1.065
+0.031
3.01%
1 gen 2009 anni
1.127
+0.062
5.81%
1 gen 2010 anni
1.283
+0.156
13.84%
1 gen 2011 anni
1.327
+0.043
3.39%
1 gen 2012 anni
1.314
-0.013
-0.98%
1 gen 2013 anni
1.46
+0.146
11.12%
1 gen 2014 anni
1.547
+0.087
5.97%
1 gen 2015 anni
1.658
+0.111
7.21%
Classificazione dei paesi secondo i statistiche attuali per anni