33
/it/
AIzaSyAYiBZKx7MnpbEhh9jyipgxe19OcubqV5w
August 1, 2025
172170
Kuwait
KWT
true
2
1
Research and development expenditure (% of GDP)
2014,2013,2012,2011,2010,2009,2008,2007,2006,2005,2004,2003,2002,2001,2000,1999,1998
Download
Biblioteca di statistiche globali →Kuwait →

Research and development expenditure (% of GDP)

Queste statistiche in altri paesi:

AlbaniaAlgeriaArgentinaArmeniaAustraliaAustriaAzerbaijanBahrainBelarusBelgiumBermudaBoliviaBosnia and HerzegovinaBotswanaBrazilBrunei DarussalamBulgariaBurkina FasoBurundiCabo VerdeCambodiaCanadaCentral Europe and the BalticsChileChinaColombiaCongo, Dem. Rep.Costa RicaCroatiaCubaCyprusCzech RepublicDenmarkEarly-demographic dividendEast Asia & PacificEast Asia & Pacific (excluding high income)East Asia & Pacific (IDA & IBRD countries)EcuadorEgypt, Arab Rep.El SalvadorEstoniaEthiopiaEuro areaEurope & Central AsiaEurope & Central Asia (excluding high income)Europe & Central Asia (IDA & IBRD countries)European UnionFaroe IslandsFinlandFranceGabonGambia, TheGeorgiaGermanyGhanaGreeceGreenlandGuatemalaHigh incomeHondurasHong Kong SAR, ChinaHungaryIBRD onlyIcelandIDA & IBRD totalIndiaIndonesiaIran, Islamic Rep.IraqIrelandIsraelItalyJamaicaJapanJordanKazakhstanKenyaKorea, Rep.KuwaitKyrgyz RepublicLao PDRLate-demographic dividendLatin America & Caribbean Latin America & Caribbean (excluding high income)Latin America & the Caribbean (IDA & IBRD countries)LatviaLesothoLithuaniaLow & middle incomeLower middle incomeLuxembourgMacao SAR, ChinaMacedonia, FYRMadagascarMalaysiaMaliMaltaMauritiusMexicoMiddle East & North Africa (excluding high income)Middle East & North Africa (IDA & IBRD countries)Middle incomeMoldovaMonacoMongoliaMontenegroMoroccoMozambiqueMyanmarNamibiaNepalNetherlandsNew ZealandNicaraguaNigeriaNorth AmericaNorwayOECD membersOmanPakistanPanamaParaguayPeruPhilippinesPolandPortugalPost-demographic dividendPuerto RicoQatarRomaniaRussian FederationSaudi ArabiaSenegalSerbiaSeychellesSingaporeSlovak RepublicSloveniaSouth AfricaSouth AsiaSouth Asia (IDA & IBRD)SpainSri LankaSt. LuciaSt. Vincent and the GrenadinesSub-Saharan Africa Sub-Saharan Africa (excluding high income)Sub-Saharan Africa (IDA & IBRD countries)SudanSwedenSwitzerlandTajikistanTanzaniaThailandTogoTrinidad and TobagoTunisiaTurkeyUgandaUkraineUnited Arab EmiratesUnited KingdomUnited StatesUpper middle incomeUruguayUzbekistanVietnamWorldZambia

Linea del tempo:

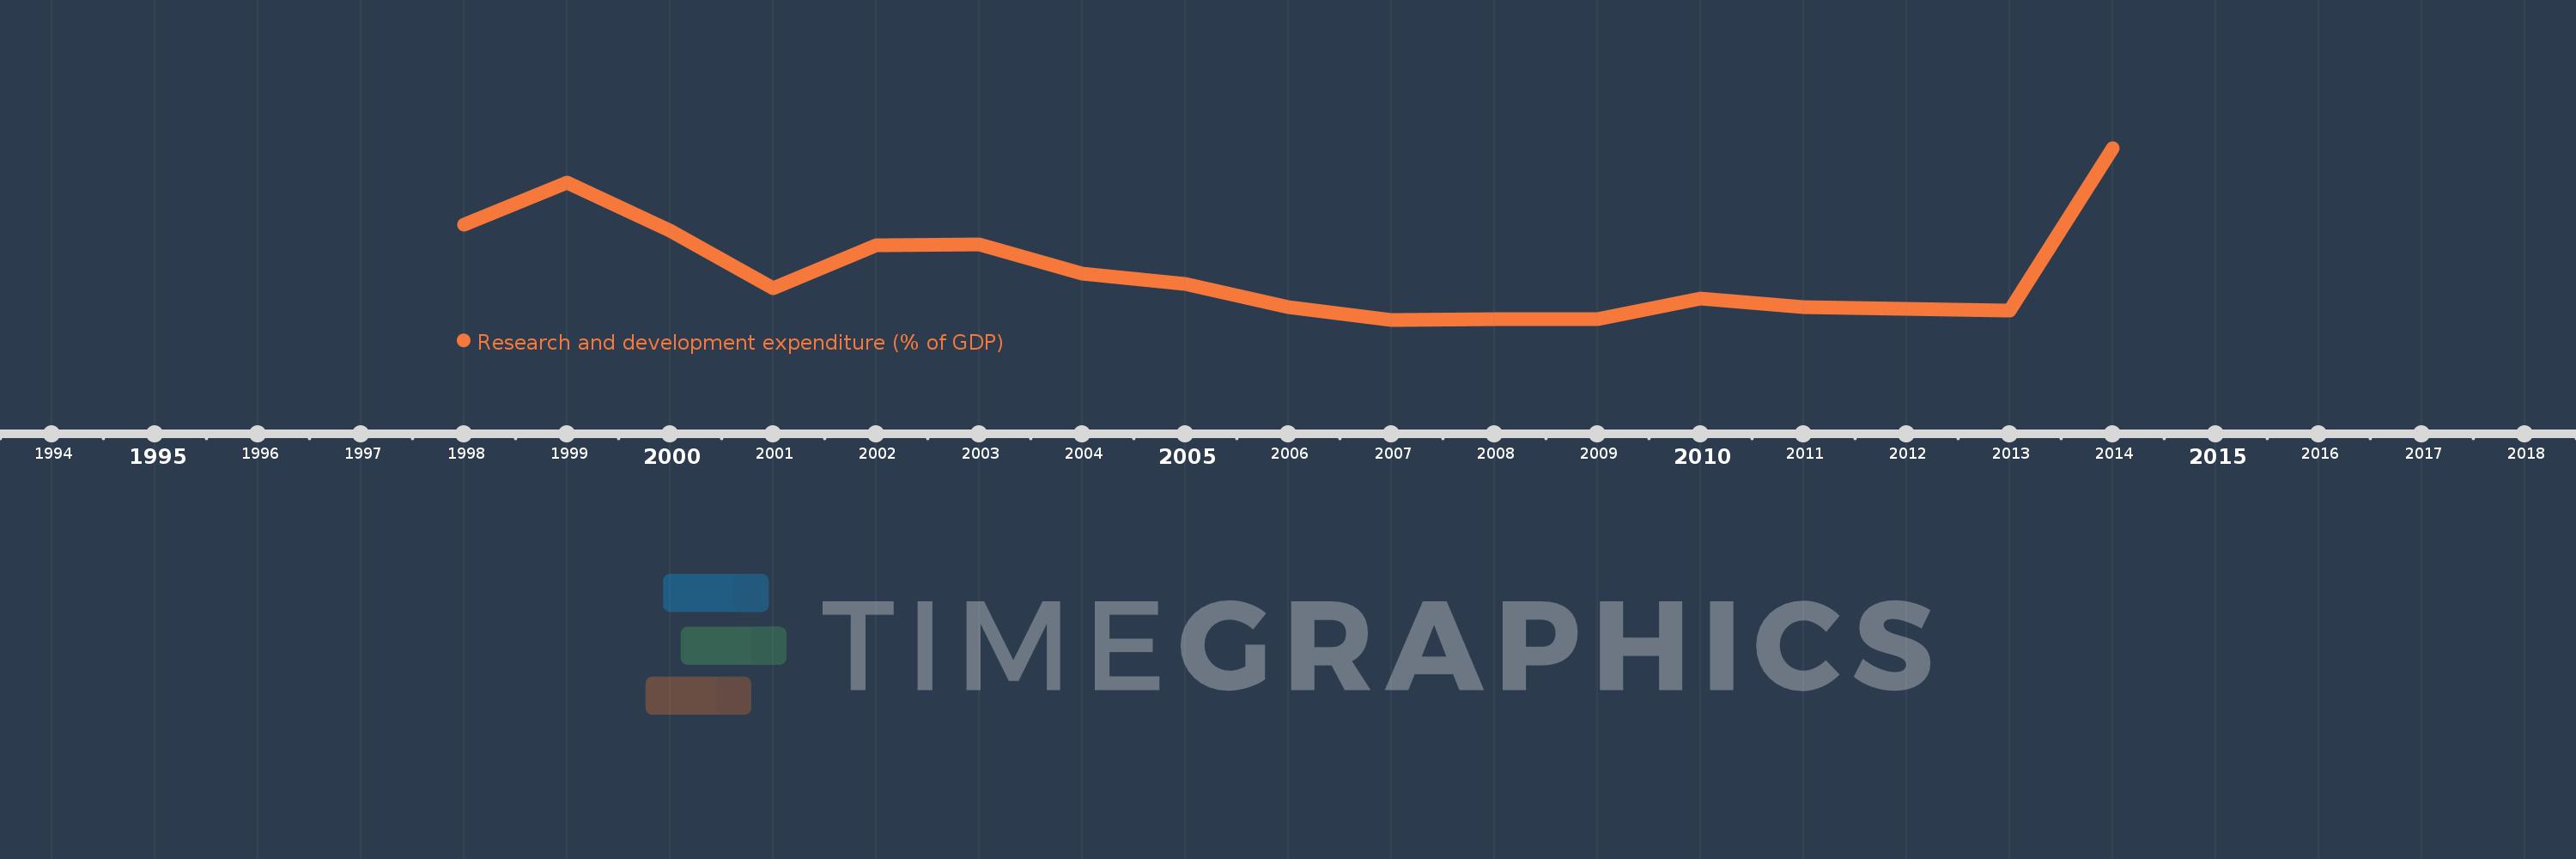
Questa scala temporale mostra un grafico dal 1998 anno al 2014 anno. Kuwait. I dati fino ad 1997 anno non disponibili. Il numero di osservazioni attuali secondo i date: 17.

La fonte (nome):

Indicatori dello sviluppo mondiale

La fonte (organizzazione):

United Nations Educational, Scientific, and Cultural Organization (UNESCO) Institute for Statistics.

Categorie:

Science & Technology

sono stati aggiornati

23 apr 2017 anni

Indicatori delle variazioni dei valori per anni

In media:
0.146
Minima:
0.085
1 gen 2007 anni
Massimo:
0.302
1 gen 2014 anni
Alla data di osservazione
Valore
Variazione assoluta
La variazione rispetto al valore precedente
1 gen 1998 anni
0.205
+0.205
0.0%
1 gen 1999 anni
0.258
+0.053
25.59%
1 gen 2000 anni
0.198
-0.06
-23.38%
1 gen 2001 anni
0.125
-0.072
-36.54%
1 gen 2002 anni
0.179
+0.053
42.57%
1 gen 2003 anni
0.18
+0.001
0.67%
1 gen 2004 anni
0.143
-0.037
-20.3%
1 gen 2005 anni
0.13
-0.013
-9.32%
1 gen 2006 anni
0.101
-0.029
-22.5%
1 gen 2007 anni
0.085
-0.016
-15.92%
1 gen 2008 anni
0.086
+0.001
1.26%
1 gen 2009 anni
0.086
0.0
-0.41%
1 gen 2010 anni
0.112
+0.027
31.23%
1 gen 2011 anni
0.101
-0.011
-9.63%
1 gen 2012 anni
0.099
-0.002
-2.39%
1 gen 2013 anni
0.097
-0.002
-1.79%
1 gen 2014 anni
0.302
+0.204
210.18%

Classificazione dei paesi secondo i statistiche attuali per anni