33
/it/
AIzaSyAYiBZKx7MnpbEhh9jyipgxe19OcubqV5w
August 1, 2025
153040
Hungary
HUN
true
2
1
Research and development expenditure (% of GDP)
2015,2014,2013,2012,2011,2010,2009,2008,2007,2006,2005,2004,2003,2002,2001,2000,1999,1998,1997
Download
Biblioteca di statistiche globali →Hungary →

Research and development expenditure (% of GDP)

Queste statistiche in altri paesi:

AlbaniaAlgeriaArgentinaArmeniaAustraliaAustriaAzerbaijanBahrainBelarusBelgiumBermudaBoliviaBosnia and HerzegovinaBotswanaBrazilBrunei DarussalamBulgariaBurkina FasoBurundiCabo VerdeCambodiaCanadaCentral Europe and the BalticsChileChinaColombiaCongo, Dem. Rep.Costa RicaCroatiaCubaCyprusCzech RepublicDenmarkEarly-demographic dividendEast Asia & PacificEast Asia & Pacific (excluding high income)East Asia & Pacific (IDA & IBRD countries)EcuadorEgypt, Arab Rep.El SalvadorEstoniaEthiopiaEuro areaEurope & Central AsiaEurope & Central Asia (excluding high income)Europe & Central Asia (IDA & IBRD countries)European UnionFaroe IslandsFinlandFranceGabonGambia, TheGeorgiaGermanyGhanaGreeceGreenlandGuatemalaHigh incomeHondurasHong Kong SAR, ChinaHungaryIBRD onlyIcelandIDA & IBRD totalIndiaIndonesiaIran, Islamic Rep.IraqIrelandIsraelItalyJamaicaJapanJordanKazakhstanKenyaKorea, Rep.KuwaitKyrgyz RepublicLao PDRLate-demographic dividendLatin America & Caribbean Latin America & Caribbean (excluding high income)Latin America & the Caribbean (IDA & IBRD countries)LatviaLesothoLithuaniaLow & middle incomeLower middle incomeLuxembourgMacao SAR, ChinaMacedonia, FYRMadagascarMalaysiaMaliMaltaMauritiusMexicoMiddle East & North Africa (excluding high income)Middle East & North Africa (IDA & IBRD countries)Middle incomeMoldovaMonacoMongoliaMontenegroMoroccoMozambiqueMyanmarNamibiaNepalNetherlandsNew ZealandNicaraguaNigeriaNorth AmericaNorwayOECD membersOmanPakistanPanamaParaguayPeruPhilippinesPolandPortugalPost-demographic dividendPuerto RicoQatarRomaniaRussian FederationSaudi ArabiaSenegalSerbiaSeychellesSingaporeSlovak RepublicSloveniaSouth AfricaSouth AsiaSouth Asia (IDA & IBRD)SpainSri LankaSt. LuciaSt. Vincent and the GrenadinesSub-Saharan Africa Sub-Saharan Africa (excluding high income)Sub-Saharan Africa (IDA & IBRD countries)SudanSwedenSwitzerlandTajikistanTanzaniaThailandTogoTrinidad and TobagoTunisiaTurkeyUgandaUkraineUnited Arab EmiratesUnited KingdomUnited StatesUpper middle incomeUruguayUzbekistanVietnamWorldZambia

Linea del tempo:

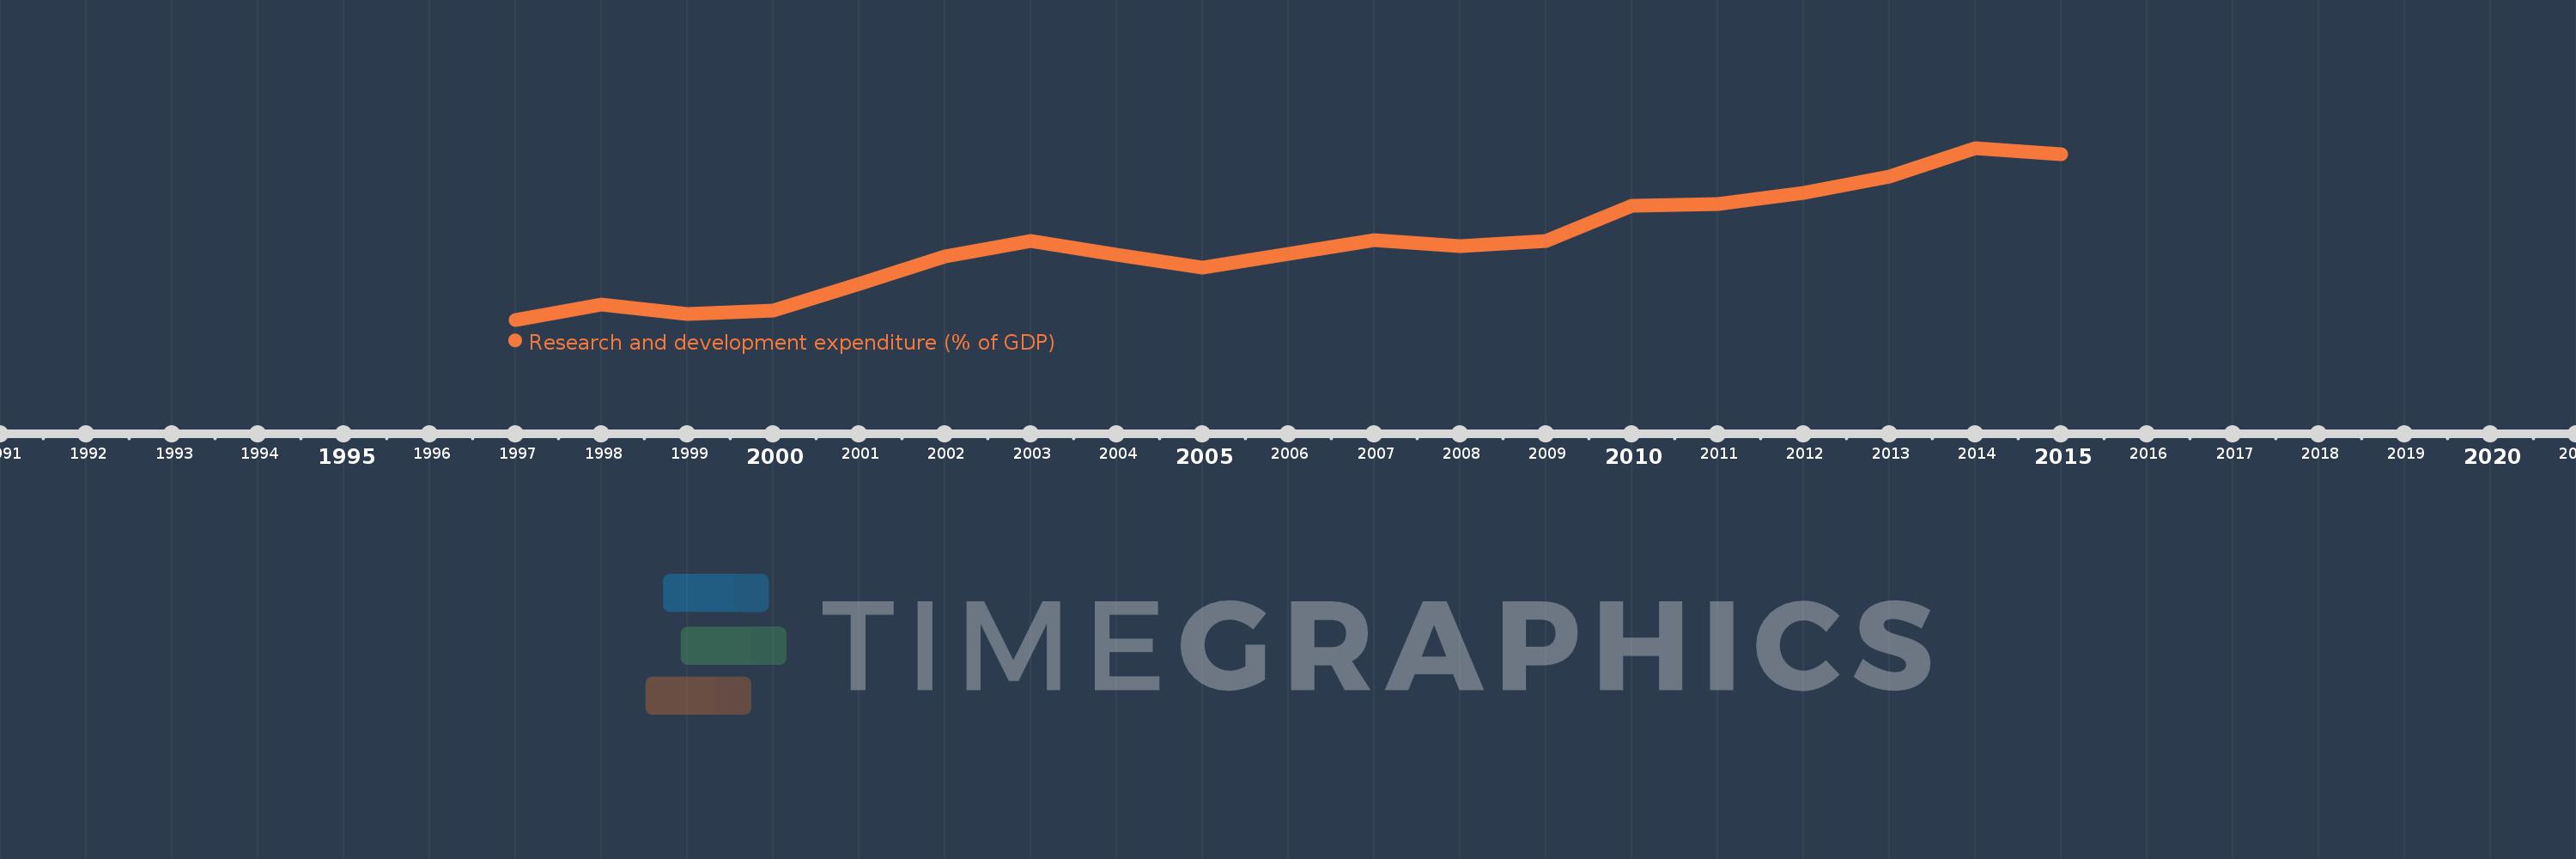
Questa scala temporale mostra un grafico dal 1997 anno al 2015 anno. Hungary. I dati fino ad 1996 anno non disponibili. Il numero di osservazioni attuali secondo i date: 19.

La fonte (nome):

Indicatori dello sviluppo mondiale

La fonte (organizzazione):

United Nations Educational, Scientific, and Cultural Organization (UNESCO) Institute for Statistics.

Categorie:

Science & Technology

sono stati aggiornati

23 apr 2017 anni

Indicatori delle variazioni dei valori per anni

In media:
0.975
Minima:
0.633
1 gen 1997 anni
Massimo:
1.397
1 gen 2014 anni
Alla data di osservazione
Valore
Variazione assoluta
La variazione rispetto al valore precedente
1 gen 1997 anni
0.633
+0.633
0.0%
1 gen 1998 anni
0.701
+0.069
10.88%
1 gen 1999 anni
0.658
-0.043
-6.14%
1 gen 2000 anni
0.672
+0.014
2.14%
1 gen 2001 anni
0.792
+0.119
17.75%
1 gen 2002 anni
0.915
+0.123
15.52%
1 gen 2003 anni
0.985
+0.07
7.67%
1 gen 2004 anni
0.922
-0.063
-6.39%
1 gen 2005 anni
0.864
-0.058
-6.3%
1 gen 2006 anni
0.925
+0.061
7.08%
1 gen 2007 anni
0.986
+0.061
6.56%
1 gen 2008 anni
0.962
-0.024
-2.41%
1 gen 2009 anni
0.985
+0.023
2.41%
1 gen 2010 anni
1.139
+0.154
15.63%
1 gen 2011 anni
1.147
+0.007
0.65%
1 gen 2012 anni
1.196
+0.049
4.31%
1 gen 2013 anni
1.27
+0.074
6.2%
1 gen 2014 anni
1.397
+0.127
9.99%
1 gen 2015 anni
1.371
-0.027
-1.9%

Classificazione dei paesi secondo i statistiche attuali per anni