33
/it/
AIzaSyAYiBZKx7MnpbEhh9jyipgxe19OcubqV5w
August 1, 2025
31099
Europe & Central Asia
ECS
false
2
1
Research and development expenditure (% of GDP)
2015,2014,2013,2012,2011,2010,2009,2008,2007,2006,2005,2004,2003,2002,2001,2000,1999,1998,1997
Download
Biblioteca di statistiche globali →Europe & Central Asia →

Research and development expenditure (% of GDP)

Queste statistiche in altri paesi:

AlbaniaAlgeriaArgentinaArmeniaAustraliaAustriaAzerbaijanBahrainBelarusBelgiumBermudaBoliviaBosnia and HerzegovinaBotswanaBrazilBrunei DarussalamBulgariaBurkina FasoBurundiCabo VerdeCambodiaCanadaCentral Europe and the BalticsChileChinaColombiaCongo, Dem. Rep.Costa RicaCroatiaCubaCyprusCzech RepublicDenmarkEarly-demographic dividendEast Asia & PacificEast Asia & Pacific (excluding high income)East Asia & Pacific (IDA & IBRD countries)EcuadorEgypt, Arab Rep.El SalvadorEstoniaEthiopiaEuro areaEurope & Central AsiaEurope & Central Asia (excluding high income)Europe & Central Asia (IDA & IBRD countries)European UnionFaroe IslandsFinlandFranceGabonGambia, TheGeorgiaGermanyGhanaGreeceGreenlandGuatemalaHigh incomeHondurasHong Kong SAR, ChinaHungaryIBRD onlyIcelandIDA & IBRD totalIndiaIndonesiaIran, Islamic Rep.IraqIrelandIsraelItalyJamaicaJapanJordanKazakhstanKenyaKorea, Rep.KuwaitKyrgyz RepublicLao PDRLate-demographic dividendLatin America & Caribbean Latin America & Caribbean (excluding high income)Latin America & the Caribbean (IDA & IBRD countries)LatviaLesothoLithuaniaLow & middle incomeLower middle incomeLuxembourgMacao SAR, ChinaMacedonia, FYRMadagascarMalaysiaMaliMaltaMauritiusMexicoMiddle East & North Africa (excluding high income)Middle East & North Africa (IDA & IBRD countries)Middle incomeMoldovaMonacoMongoliaMontenegroMoroccoMozambiqueMyanmarNamibiaNepalNetherlandsNew ZealandNicaraguaNigeriaNorth AmericaNorwayOECD membersOmanPakistanPanamaParaguayPeruPhilippinesPolandPortugalPost-demographic dividendPuerto RicoQatarRomaniaRussian FederationSaudi ArabiaSenegalSerbiaSeychellesSingaporeSlovak RepublicSloveniaSouth AfricaSouth AsiaSouth Asia (IDA & IBRD)SpainSri LankaSt. LuciaSt. Vincent and the GrenadinesSub-Saharan Africa Sub-Saharan Africa (excluding high income)Sub-Saharan Africa (IDA & IBRD countries)SudanSwedenSwitzerlandTajikistanTanzaniaThailandTogoTrinidad and TobagoTunisiaTurkeyUgandaUkraineUnited Arab EmiratesUnited KingdomUnited StatesUpper middle incomeUruguayUzbekistanVietnamWorldZambia

Linea del tempo:

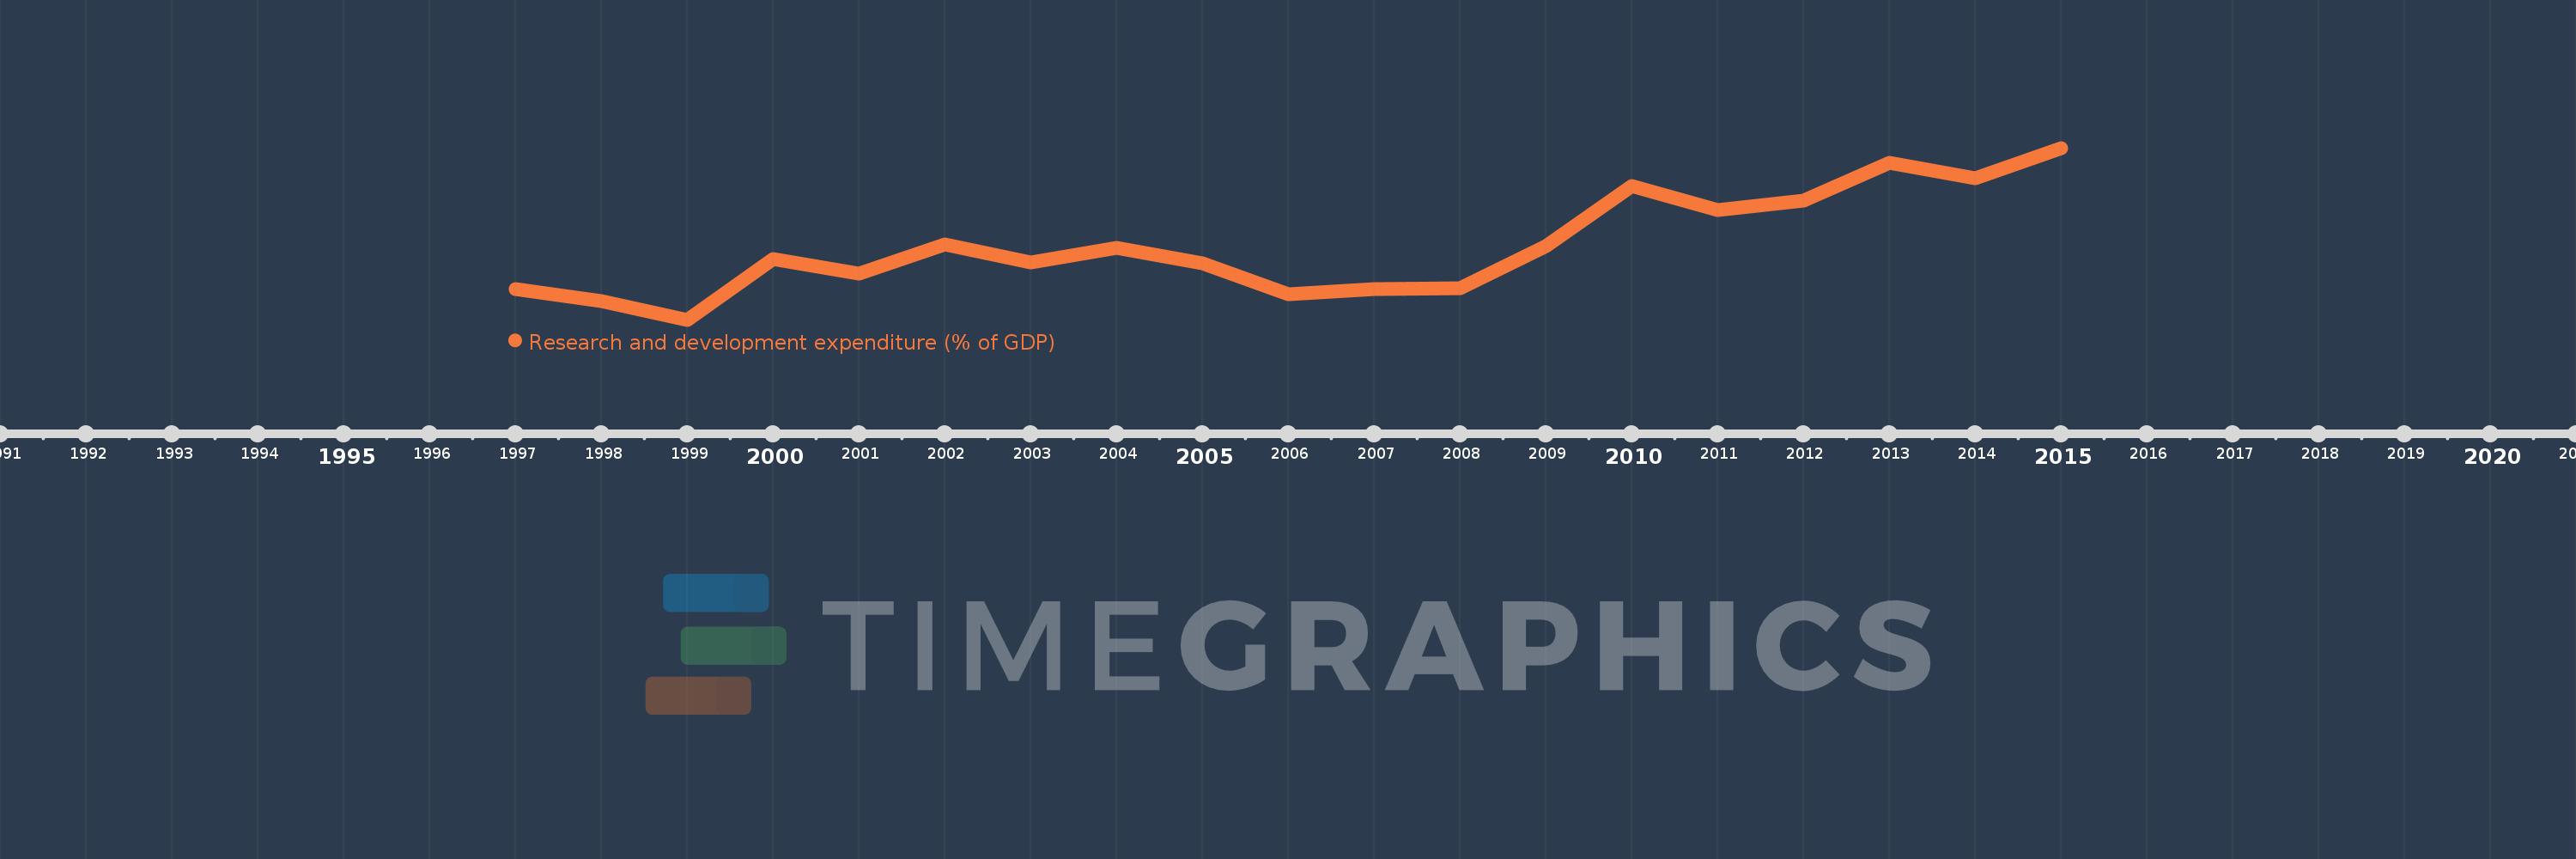
Questa scala temporale mostra un grafico dal 1997 anno al 2015 anno. Europe & Central Asia. I dati fino ad 1996 anno non disponibili. Il numero di osservazioni attuali secondo i date: 19.

La fonte (nome):

Indicatori dello sviluppo mondiale

La fonte (organizzazione):

United Nations Educational, Scientific, and Cultural Organization (UNESCO) Institute for Statistics.

Categorie:

Science & Technology

sono stati aggiornati

23 apr 2017 anni

Indicatori delle variazioni dei valori per anni

In media:
1.738
Minima:
1.626
1 gen 1999 anni
Massimo:
1.885
1 gen 2015 anni
Alla data di osservazione
Valore
Variazione assoluta
La variazione rispetto al valore precedente
1 gen 1997 anni
1.672
+1.672
0.0%
1 gen 1998 anni
1.654
-0.018
-1.05%
1 gen 1999 anni
1.626
-0.029
-1.73%
1 gen 2000 anni
1.717
+0.092
5.65%
1 gen 2001 anni
1.695
-0.022
-1.3%
1 gen 2002 anni
1.739
+0.044
2.59%
1 gen 2003 anni
1.712
-0.027
-1.53%
1 gen 2004 anni
1.735
+0.022
1.3%
1 gen 2005 anni
1.711
-0.024
-1.39%
1 gen 2006 anni
1.665
-0.045
-2.66%
1 gen 2007 anni
1.672
+0.006
0.38%
1 gen 2008 anni
1.673
+0.001
0.06%
1 gen 2009 anni
1.737
+0.064
3.82%
1 gen 2010 anni
1.827
+0.091
5.22%
1 gen 2011 anni
1.791
-0.036
-1.99%
1 gen 2012 anni
1.806
+0.015
0.84%
1 gen 2013 anni
1.862
+0.057
3.14%
1 gen 2014 anni
1.839
-0.023
-1.25%
1 gen 2015 anni
1.885
+0.046
2.52%

Classificazione dei paesi secondo i statistiche attuali per anni