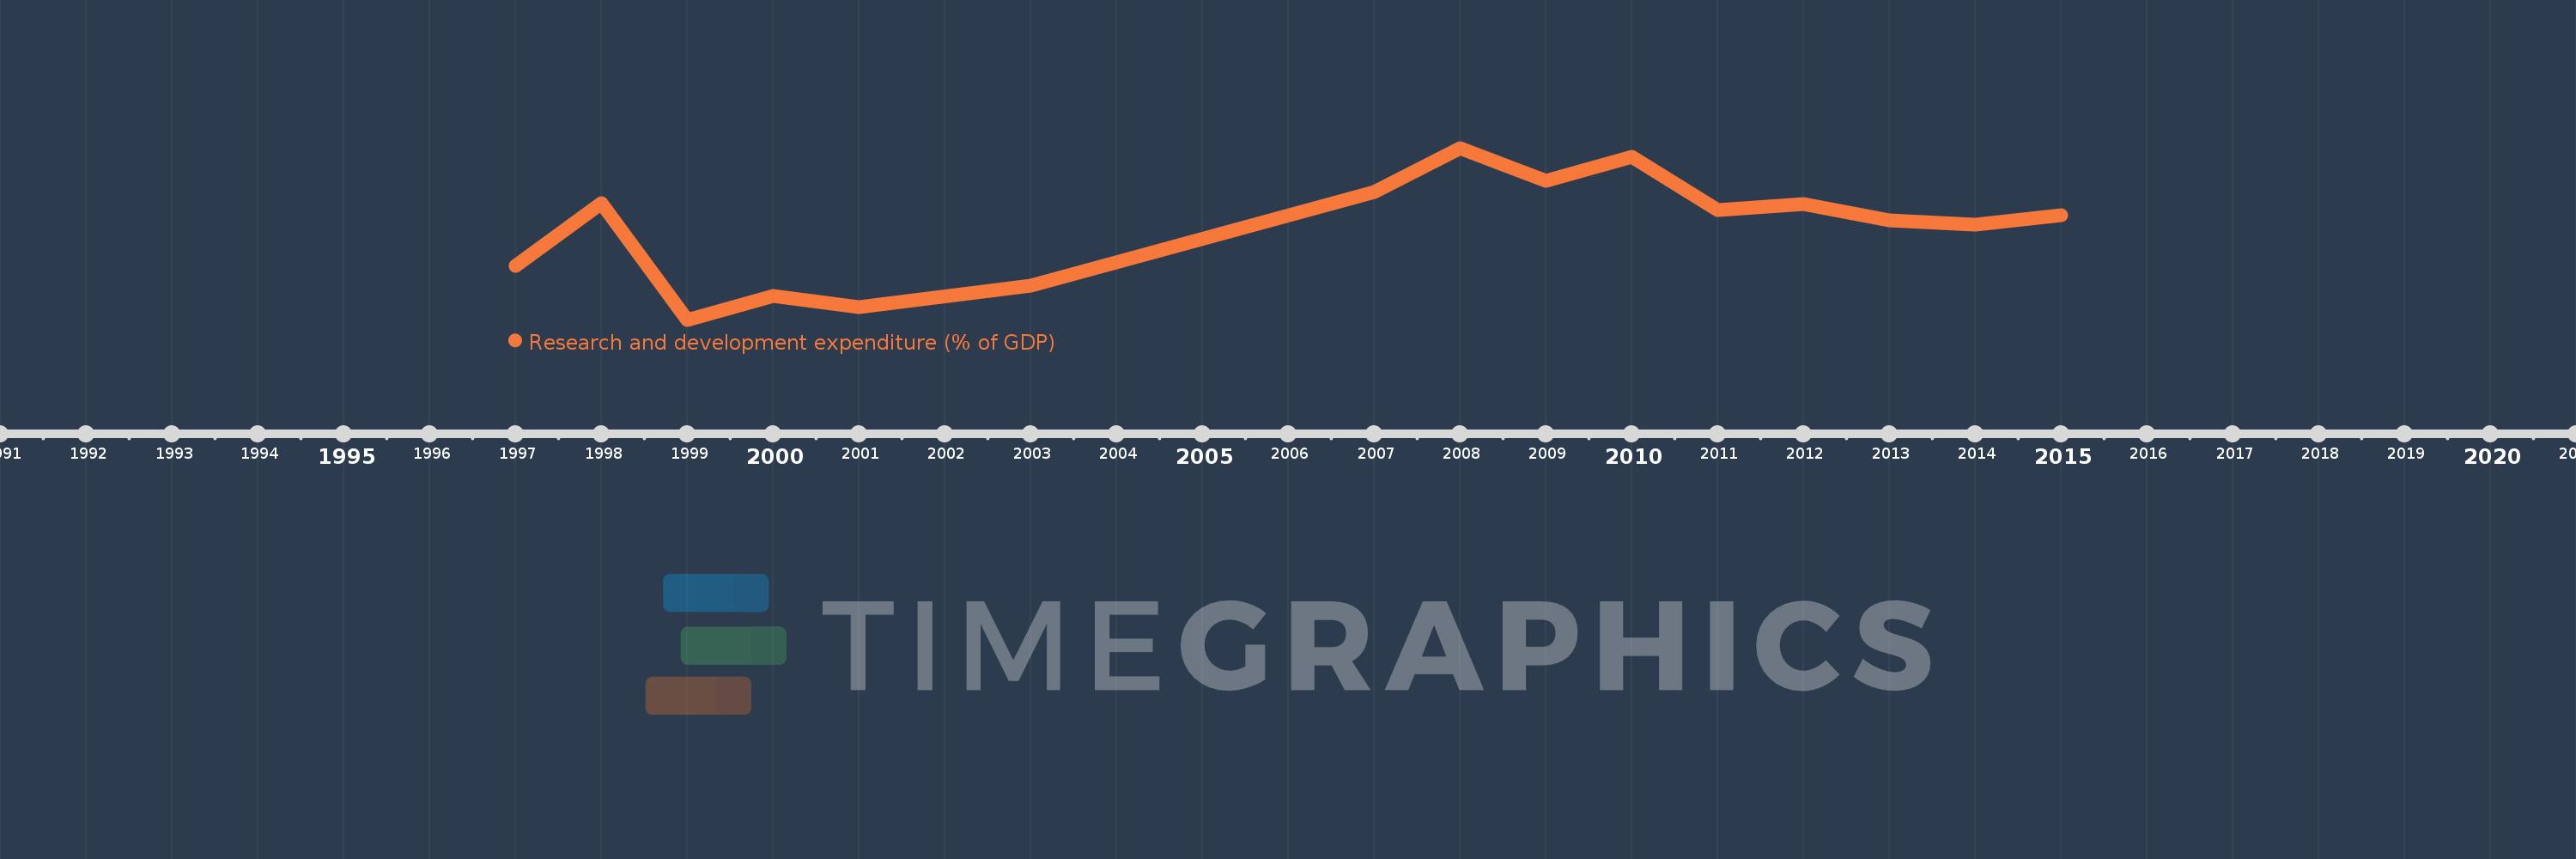
Questa scala temporale mostra un grafico dal 1997 anno al 2015 anno. Uruguay. I dati fino ad 1996 anno non disponibili. Il numero di osservazioni attuali secondo i date: 15.
La fonte (nome):
Indicatori dello sviluppo mondiale
La fonte (organizzazione):
United Nations Educational, Scientific, and Cultural Organization (UNESCO) Institute for Statistics.
Categorie:
Science & Technology
sono stati aggiornati
23 apr 2017 anni
Indicatori delle variazioni dei valori per anni
In media:
0.316
Minima:
0.192
1 gen 1999 anni
Massimo:
0.425
1 gen 2008 anni
Alla data di osservazione
Valore
Variazione assoluta
La variazione rispetto al valore precedente
1 gen 1997 anni
0.265
+0.265
0.0%
1 gen 1998 anni
0.35
+0.085
32.05%
1 gen 1999 anni
0.192
-0.158
-45.17%
1 gen 2000 anni
0.224
+0.032
16.84%
1 gen 2001 anni
0.209
-0.015
-6.66%
1 gen 2003 anni
0.238
+0.029
13.83%
1 gen 2007 anni
0.365
+0.127
53.41%
1 gen 2008 anni
0.425
+0.059
16.24%
1 gen 2009 anni
0.38
-0.045
-10.59%
1 gen 2010 anni
0.413
+0.033
8.64%
1 gen 2011 anni
0.341
-0.071
-17.3%
1 gen 2012 anni
0.349
+0.008
2.21%
1 gen 2013 anni
0.327
-0.022
-6.27%
1 gen 2014 anni
0.321
-0.006
-1.73%
1 gen 2015 anni
0.334
+0.013
4.13%
Classificazione dei paesi secondo i statistiche attuali per anni