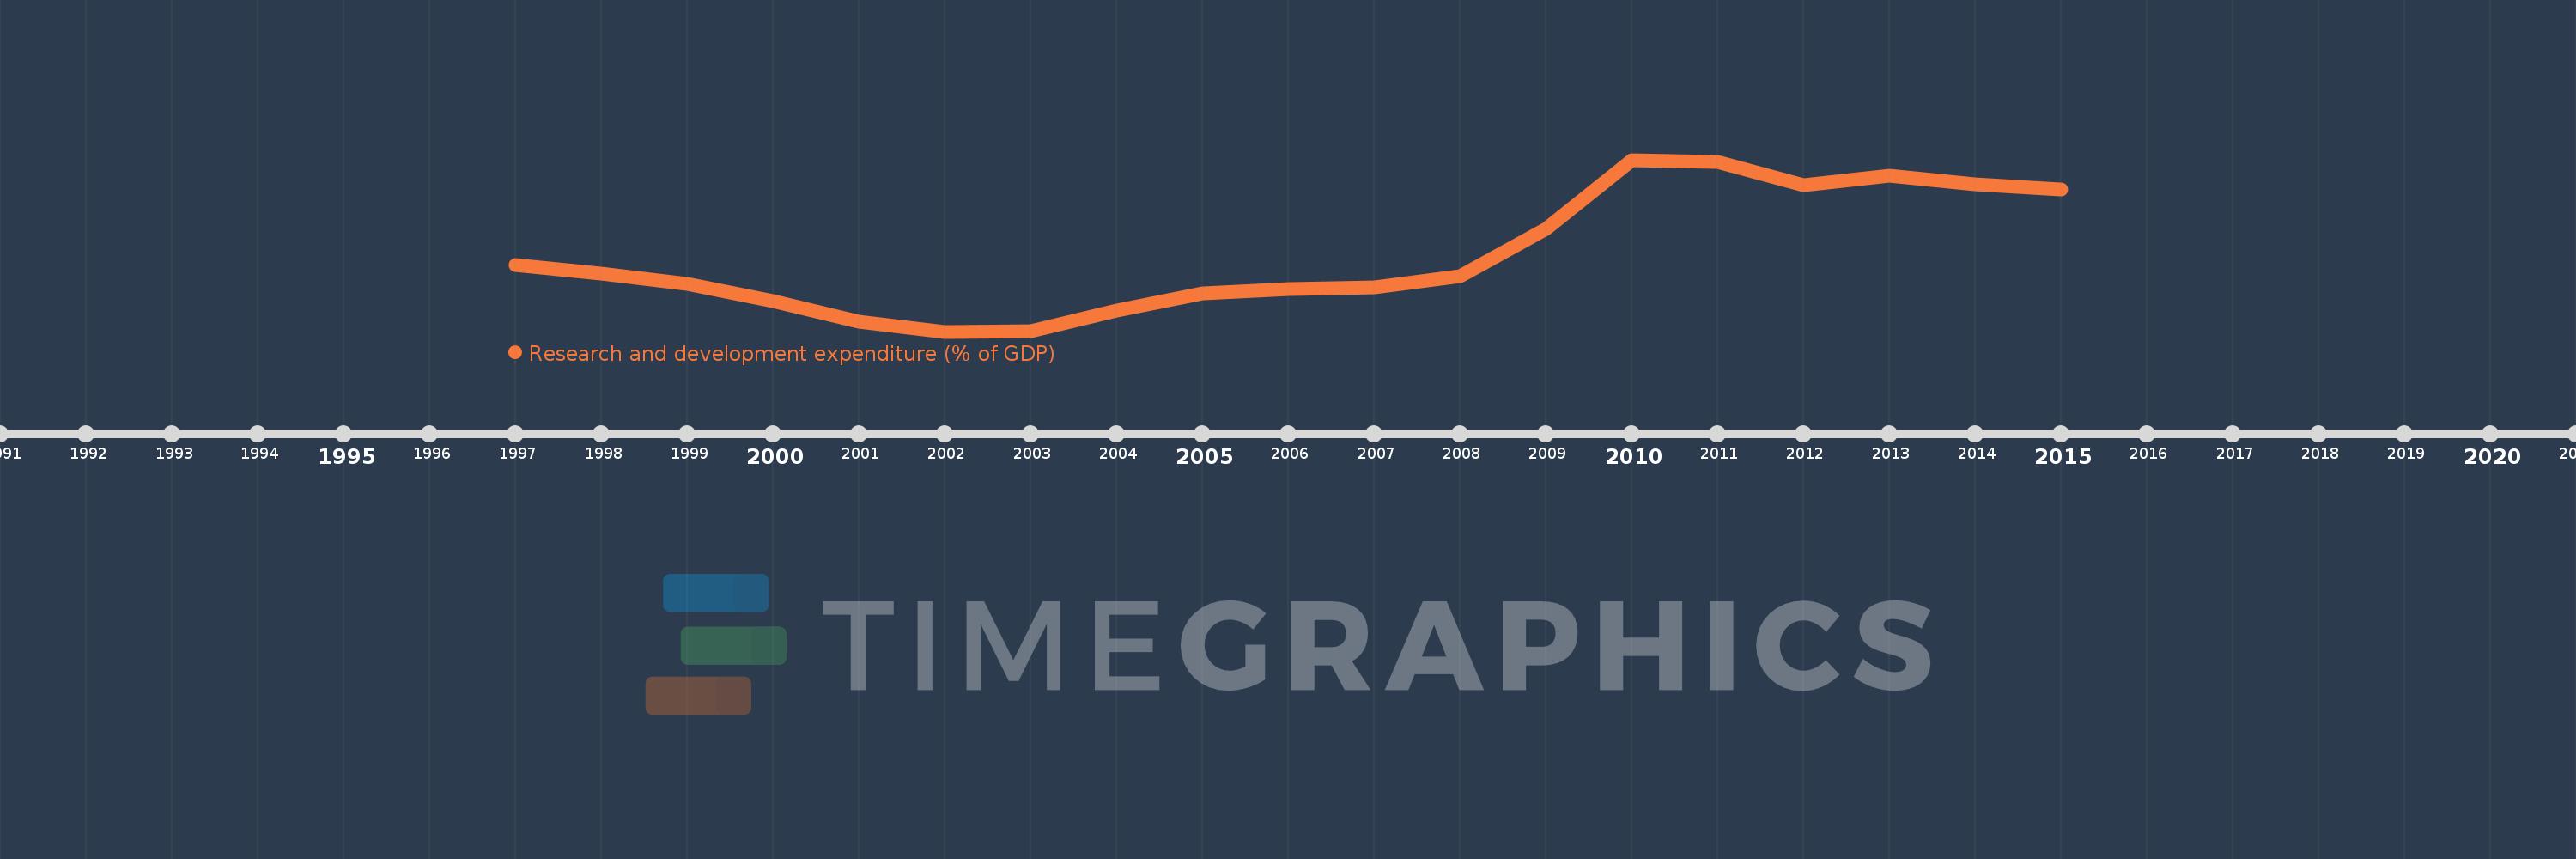
Questa scala temporale mostra un grafico dal 1997 anno al 2015 anno. Ireland. I dati fino ad 1996 anno non disponibili. Il numero di osservazioni attuali secondo i date: 19.
La fonte (nome):
Indicatori dello sviluppo mondiale
La fonte (organizzazione):
United Nations Educational, Scientific, and Cultural Organization (UNESCO) Institute for Statistics.
Categorie:
Science & Technology
sono stati aggiornati
23 apr 2017 anni
Indicatori delle variazioni dei valori per anni
In media:
1.303
Minima:
1.054
1 gen 2002 anni
Massimo:
1.615
1 gen 2010 anni
Alla data di osservazione
Valore
Variazione assoluta
La variazione rispetto al valore precedente
1 gen 1997 anni
1.271
+1.271
0.0%
1 gen 1998 anni
1.243
-0.027
-2.14%
1 gen 1999 anni
1.21
-0.034
-2.7%
1 gen 2000 anni
1.153
-0.056
-4.65%
1 gen 2001 anni
1.085
-0.068
-5.92%
1 gen 2002 anni
1.054
-0.032
-2.91%
1 gen 2003 anni
1.056
+0.003
0.24%
1 gen 2004 anni
1.123
+0.067
6.31%
1 gen 2005 anni
1.178
+0.056
4.95%
1 gen 2006 anni
1.194
+0.016
1.35%
1 gen 2007 anni
1.199
+0.005
0.38%
1 gen 2008 anni
1.234
+0.035
2.95%
1 gen 2009 anni
1.389
+0.155
12.57%
1 gen 2010 anni
1.615
+0.225
16.21%
1 gen 2011 anni
1.607
-0.008
-0.49%
1 gen 2012 anni
1.533
-0.074
-4.6%
1 gen 2013 anni
1.564
+0.031
2.02%
1 gen 2014 anni
1.536
-0.028
-1.77%
1 gen 2015 anni
1.519
-0.017
-1.11%
Classificazione dei paesi secondo i statistiche attuali per anni