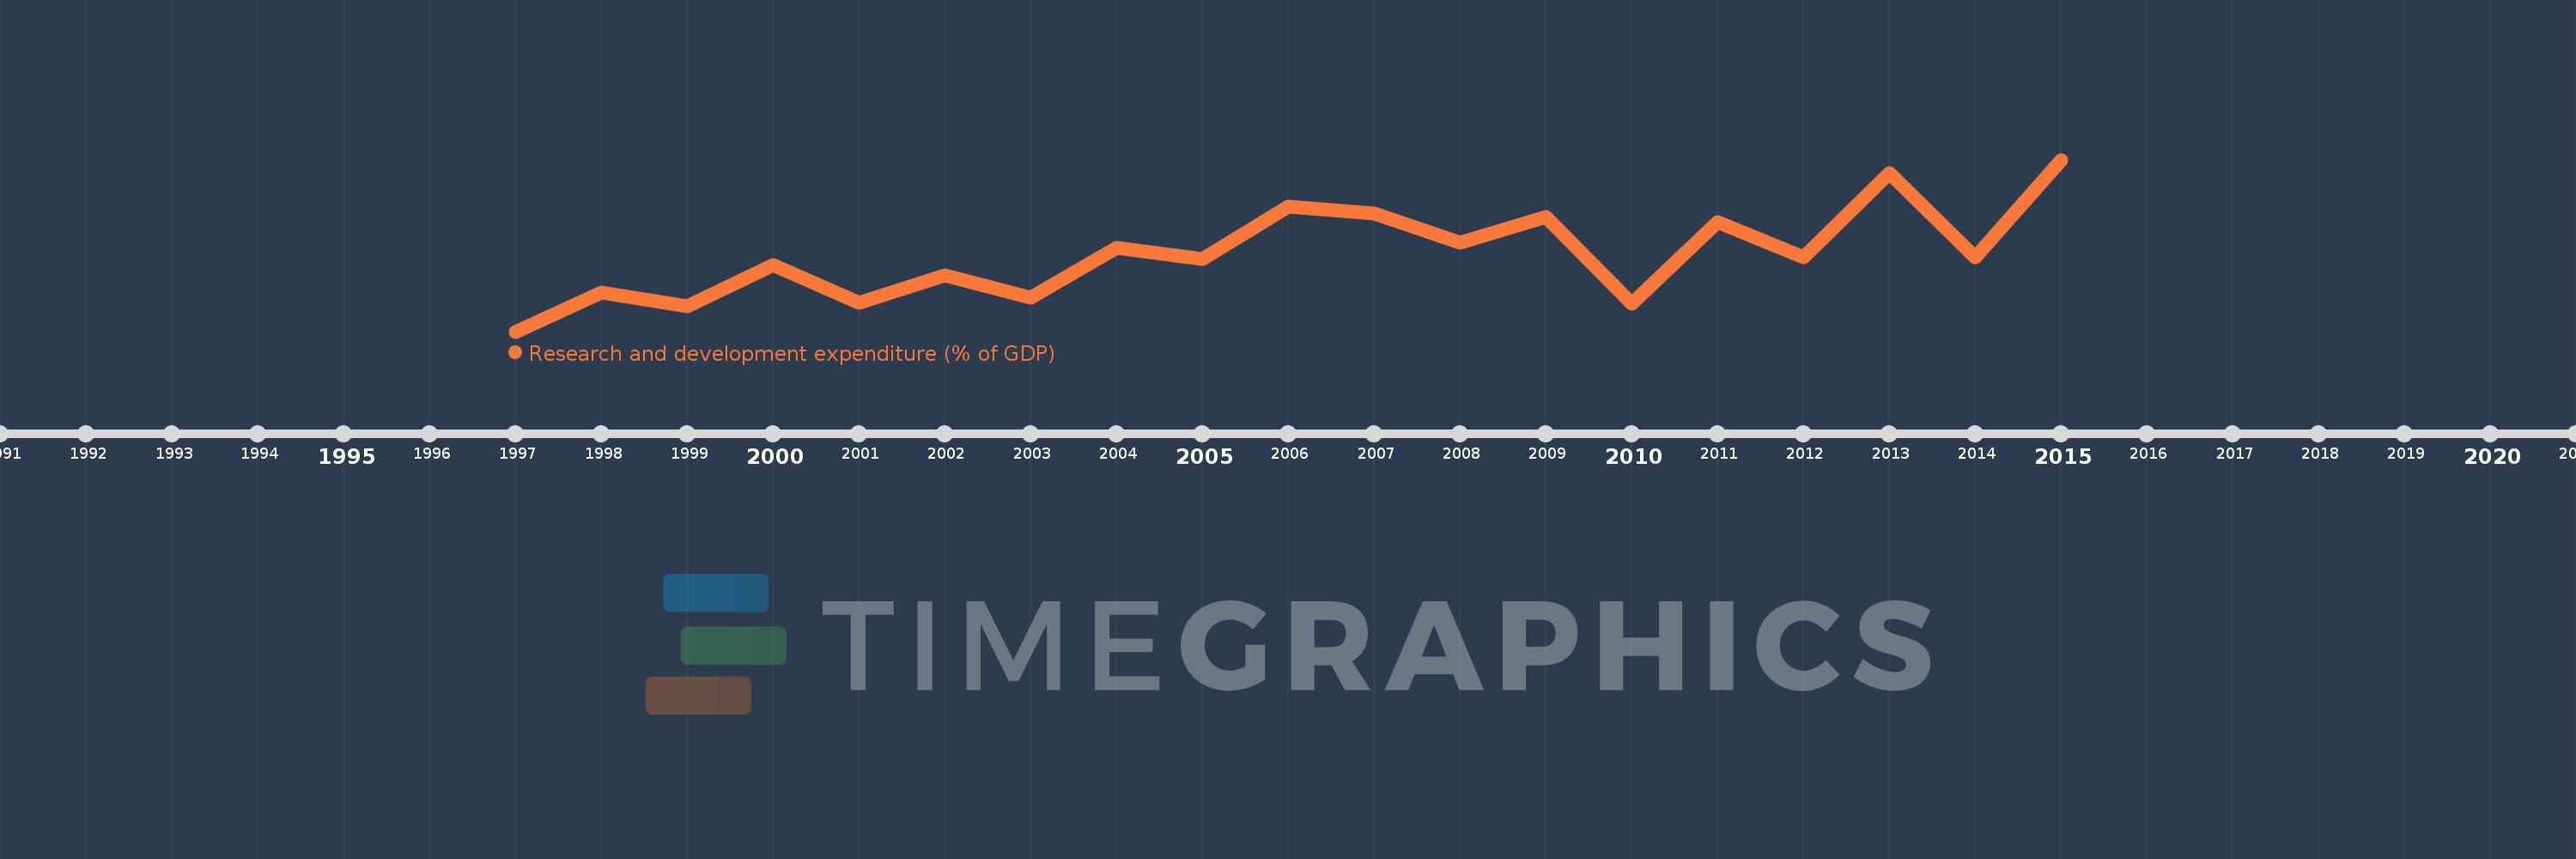
Questa scala temporale mostra un grafico dal 1997 anno al 2015 anno. East Asia & Pacific. I dati fino ad 1996 anno non disponibili. Il numero di osservazioni attuali secondo i date: 19.
La fonte (nome):
Indicatori dello sviluppo mondiale
La fonte (organizzazione):
United Nations Educational, Scientific, and Cultural Organization (UNESCO) Institute for Statistics.
Categorie:
Science & Technology
sono stati aggiornati
23 apr 2017 anni
Indicatori delle variazioni dei valori per anni
In media:
2.398
Minima:
2.256
1 gen 1997 anni
Massimo:
2.572
1 gen 2015 anni
Alla data di osservazione
Valore
Variazione assoluta
La variazione rispetto al valore precedente
1 gen 1997 anni
2.256
+2.256
0.0%
1 gen 1998 anni
2.328
+0.072
3.2%
1 gen 1999 anni
2.302
-0.026
-1.14%
1 gen 2000 anni
2.378
+0.077
3.33%
1 gen 2001 anni
2.309
-0.069
-2.9%
1 gen 2002 anni
2.36
+0.051
2.21%
1 gen 2003 anni
2.318
-0.042
-1.78%
1 gen 2004 anni
2.41
+0.092
3.96%
1 gen 2005 anni
2.39
-0.02
-0.83%
1 gen 2006 anni
2.486
+0.096
4.0%
1 gen 2007 anni
2.473
-0.013
-0.53%
1 gen 2008 anni
2.419
-0.054
-2.18%
1 gen 2009 anni
2.467
+0.048
1.98%
1 gen 2010 anni
2.308
-0.159
-6.43%
1 gen 2011 anni
2.458
+0.15
6.49%
1 gen 2012 anni
2.392
-0.065
-2.66%
1 gen 2013 anni
2.548
+0.156
6.53%
1 gen 2014 anni
2.392
-0.156
-6.14%
1 gen 2015 anni
2.572
+0.18
7.51%
Classificazione dei paesi secondo i statistiche attuali per anni