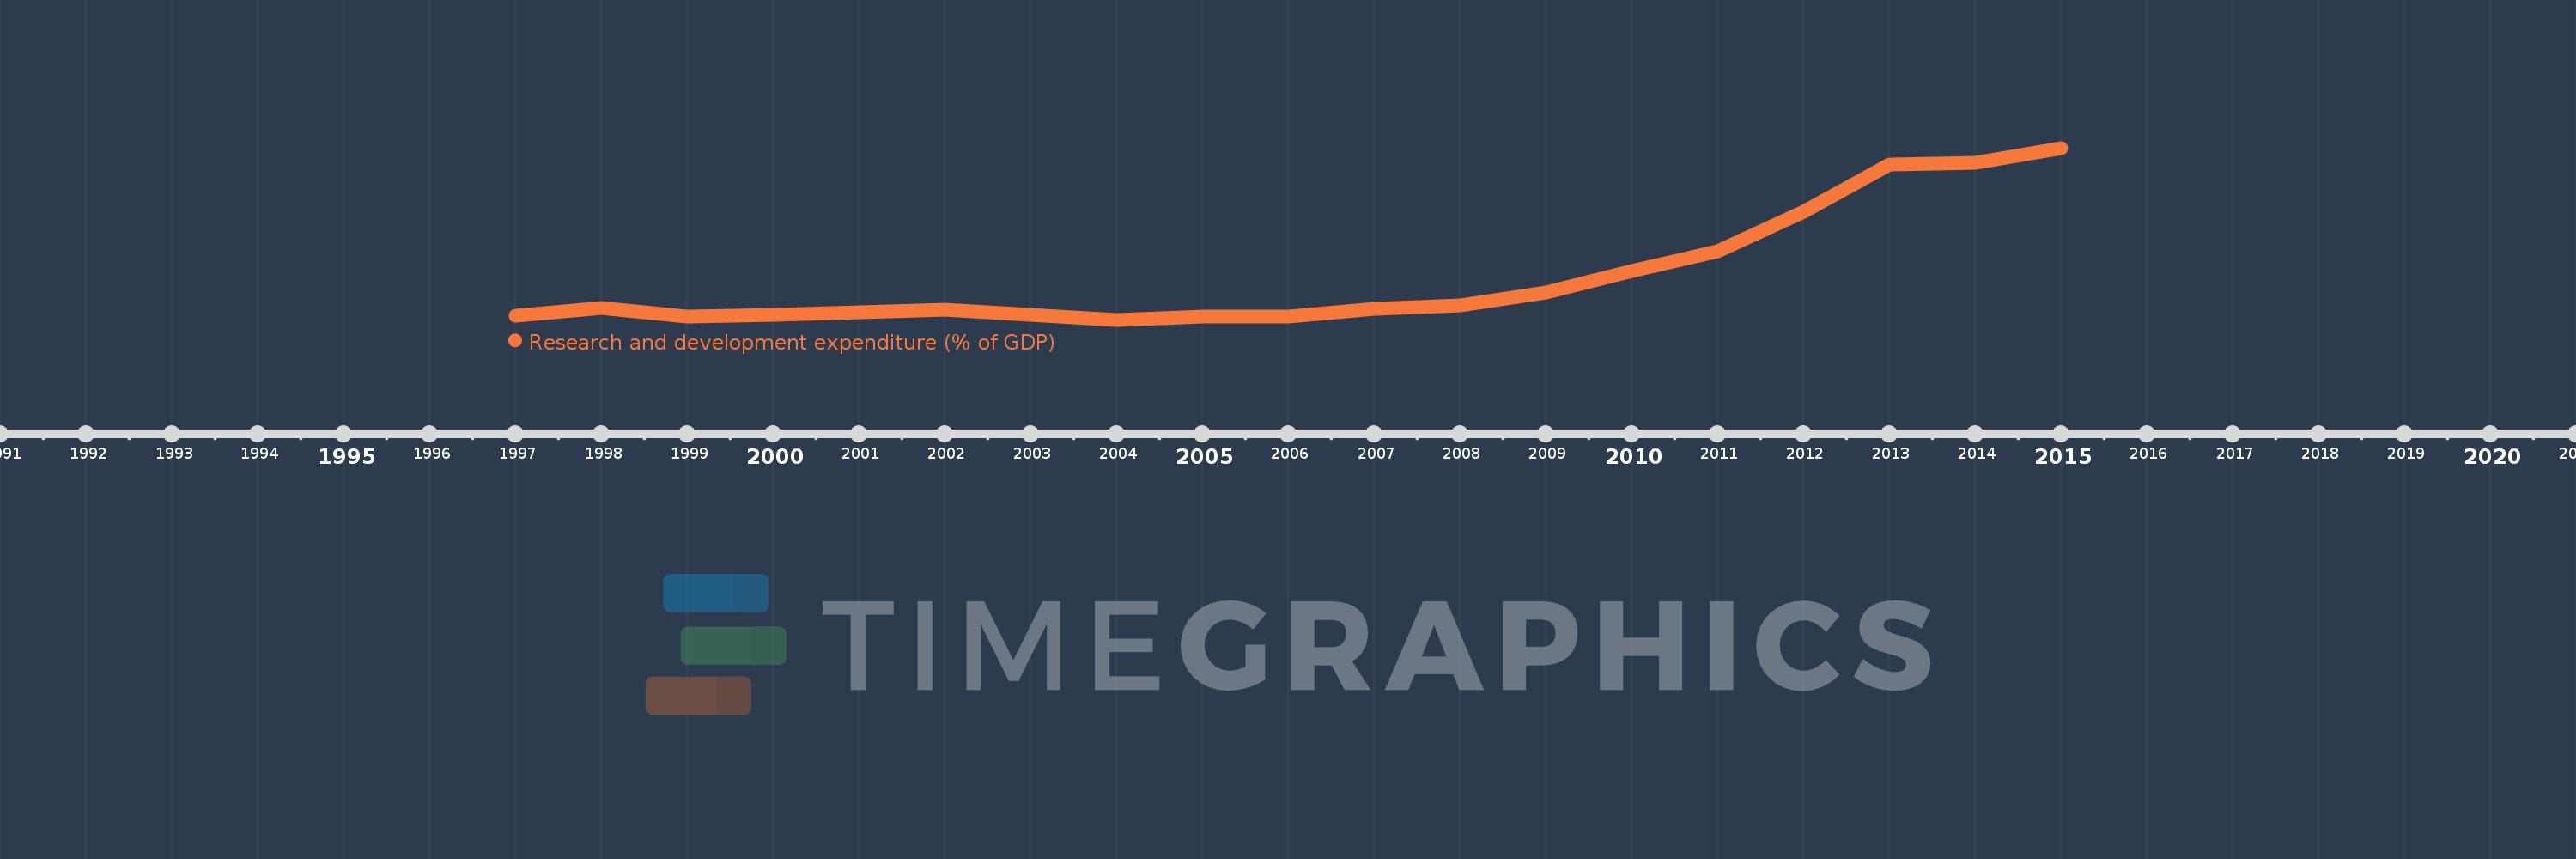
Questa scala temporale mostra un grafico dal 1997 anno al 2015 anno. Central Europe and the Baltics. I dati fino ad 1996 anno non disponibili. Il numero di osservazioni attuali secondo i date: 19.
La fonte (nome):
Indicatori dello sviluppo mondiale
La fonte (organizzazione):
United Nations Educational, Scientific, and Cultural Organization (UNESCO) Institute for Statistics.
Categorie:
Science & Technology
sono stati aggiornati
23 apr 2017 anni
Indicatori delle variazioni dei valori per anni
In media:
0.821
Minima:
0.73
1 gen 2004 anni
Massimo:
1.095
1 gen 2015 anni
Alla data di osservazione
Valore
Variazione assoluta
La variazione rispetto al valore precedente
1 gen 1997 anni
0.738
+0.738
0.0%
1 gen 1998 anni
0.755
+0.017
2.3%
1 gen 1999 anni
0.736
-0.019
-2.55%
1 gen 2000 anni
0.741
+0.005
0.7%
1 gen 2001 anni
0.746
+0.005
0.74%
1 gen 2002 anni
0.751
+0.004
0.6%
1 gen 2003 anni
0.74
-0.01
-1.38%
1 gen 2004 anni
0.73
-0.01
-1.35%
1 gen 2005 anni
0.736
+0.006
0.76%
1 gen 2006 anni
0.737
+0.001
0.19%
1 gen 2007 anni
0.753
+0.016
2.17%
1 gen 2008 anni
0.76
+0.006
0.81%
1 gen 2009 anni
0.788
+0.028
3.72%
1 gen 2010 anni
0.834
+0.046
5.89%
1 gen 2011 anni
0.876
+0.042
5.03%
1 gen 2012 anni
0.96
+0.084
9.61%
1 gen 2013 anni
1.06
+0.1
10.43%
1 gen 2014 anni
1.064
+0.004
0.36%
1 gen 2015 anni
1.095
+0.031
2.93%
Classificazione dei paesi secondo i statistiche attuali per anni