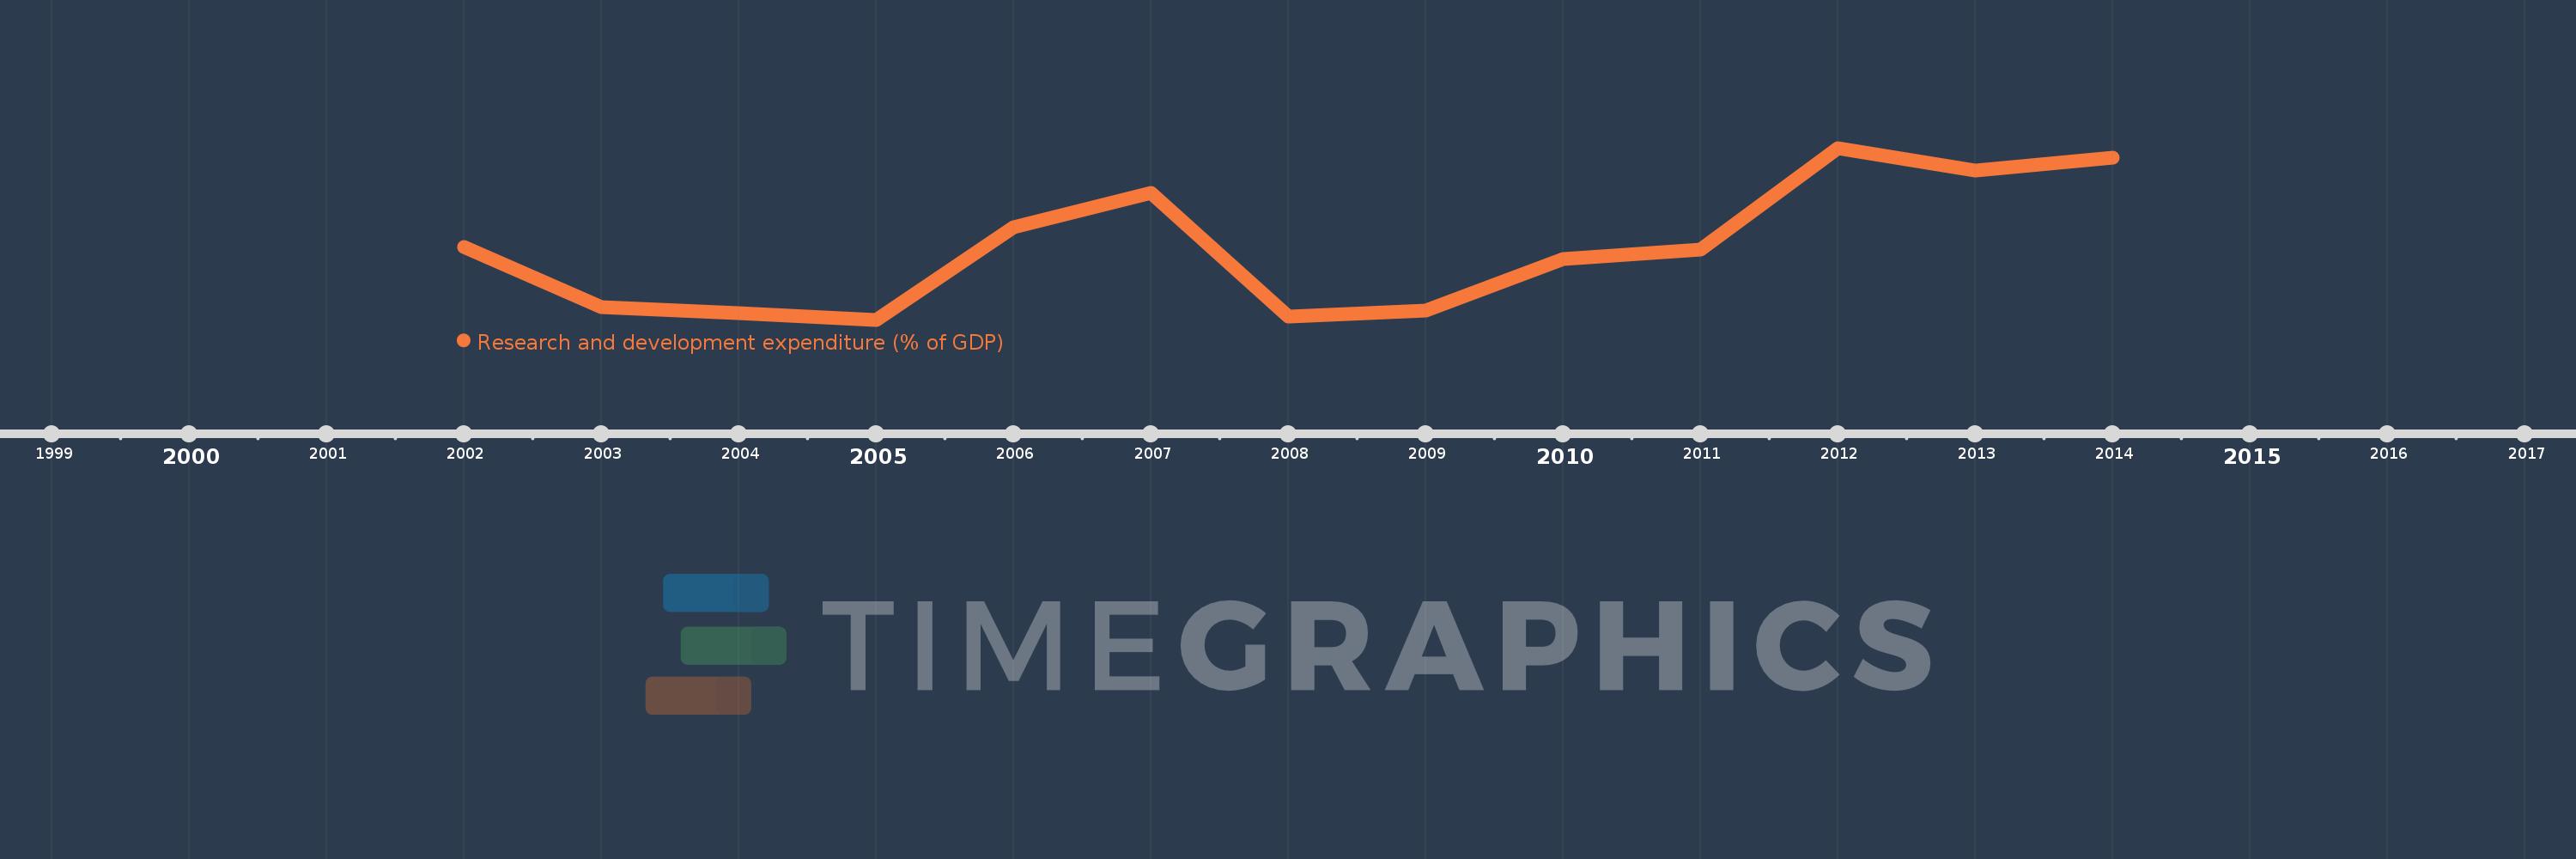
Questa scala temporale mostra un grafico dal 2002 anno al 2014 anno. Tajikistan. I dati fino ad 2001 anno non disponibili. Il numero di osservazioni attuali secondo i date: 13.
La fonte (nome):
Indicatori dello sviluppo mondiale
La fonte (organizzazione):
United Nations Educational, Scientific, and Cultural Organization (UNESCO) Institute for Statistics.
Categorie:
Science & Technology
sono stati aggiornati
23 apr 2017 anni
Indicatori delle variazioni dei valori per anni
In media:
0.09
Minima:
0.067
1 gen 2005 anni
Massimo:
0.121
1 gen 2012 anni
Alla data di osservazione
Valore
Variazione assoluta
La variazione rispetto al valore precedente
1 gen 2002 anni
0.09
+0.09
0.0%
1 gen 2003 anni
0.071
-0.019
-21.05%
1 gen 2004 anni
0.069
-0.002
-2.52%
1 gen 2005 anni
0.067
-0.002
-2.8%
1 gen 2006 anni
0.096
+0.029
42.9%
1 gen 2007 anni
0.107
+0.012
12.14%
1 gen 2008 anni
0.068
-0.04
-36.84%
1 gen 2009 anni
0.07
+0.002
3.02%
1 gen 2010 anni
0.086
+0.016
22.83%
1 gen 2011 anni
0.089
+0.003
3.93%
1 gen 2012 anni
0.121
+0.032
36.28%
1 gen 2013 anni
0.114
-0.007
-5.99%
1 gen 2014 anni
0.118
+0.003
3.06%
Classificazione dei paesi secondo i statistiche attuali per anni