30
/fr/
AIzaSyAYiBZKx7MnpbEhh9jyipgxe19OcubqV5w
April 1, 2024
87986
Bolivia
BOL
true
2
1
Stocks traded, total value (current US$)
2013,2012,2011,2010,2009,2007,2006,2005,2004,2003,2002,2001,2000,1999,1998,1997,1996
Download
Bibliothèque de statistiques globales →Bolivia →

Stocks traded, total value (current US$)

Cette statistique dans les autres pays:

Arab WorldArgentinaArmeniaAustraliaAustriaBahrainBangladeshBarbadosBelgiumBermudaBoliviaBotswanaBrazilBulgariaCanadaCayman IslandsCentral Europe and the BalticsChannel IslandsChileChinaColombiaCosta RicaCote d'IvoireCroatiaCyprusCzech RepublicDenmarkEarly-demographic dividendEast Asia & PacificEast Asia & Pacific (excluding high income)East Asia & Pacific (IDA & IBRD countries)EcuadorEgypt, Arab Rep.El SalvadorEstoniaEuro areaEurope & Central AsiaEurope & Central Asia (excluding high income)Europe & Central Asia (IDA & IBRD countries)European UnionFijiFinlandFranceGeorgiaGermanyGhanaGreeceGuyanaHigh incomeHong Kong SAR, ChinaHungaryIBRD onlyIcelandIDA & IBRD totalIDA blendIDA totalIndiaIndonesiaIran, Islamic Rep.IrelandIsraelItalyJamaicaJapanJordanKazakhstanKenyaKorea, Rep.KuwaitKyrgyz RepublicLate-demographic dividendLatin America & Caribbean Latin America & Caribbean (excluding high income)Latin America & the Caribbean (IDA & IBRD countries)LatviaLebanonLithuaniaLow & middle incomeLower middle incomeLuxembourgMacedonia, FYRMalawiMalaysiaMaltaMauritiusMexicoMiddle East & North AfricaMiddle East & North Africa (excluding high income)Middle East & North Africa (IDA & IBRD countries)Middle incomeMoldovaMongoliaMontenegroMoroccoNamibiaNetherlandsNew ZealandNigeriaNorth AmericaNorwayOECD membersOmanOther small statesPakistanPanamaPapua New GuineaParaguayPeruPhilippinesPolandPortugalPost-demographic dividendQatarRomaniaRussian FederationSaudi ArabiaSerbiaSeychellesSingaporeSlovak RepublicSloveniaSouth AfricaSouth AsiaSouth Asia (IDA & IBRD)SpainSri LankaSt. Kitts and NevisSub-Saharan Africa Sub-Saharan Africa (excluding high income)Sub-Saharan Africa (IDA & IBRD countries)SwazilandSwedenSwitzerlandTanzaniaThailandTrinidad and TobagoTunisiaTurkeyUgandaUkraineUnited Arab EmiratesUnited KingdomUnited StatesUpper middle incomeUruguayUzbekistanVenezuela, RBVietnamWest Bank and GazaWorldZambiaZimbabwe

La ligne de temps

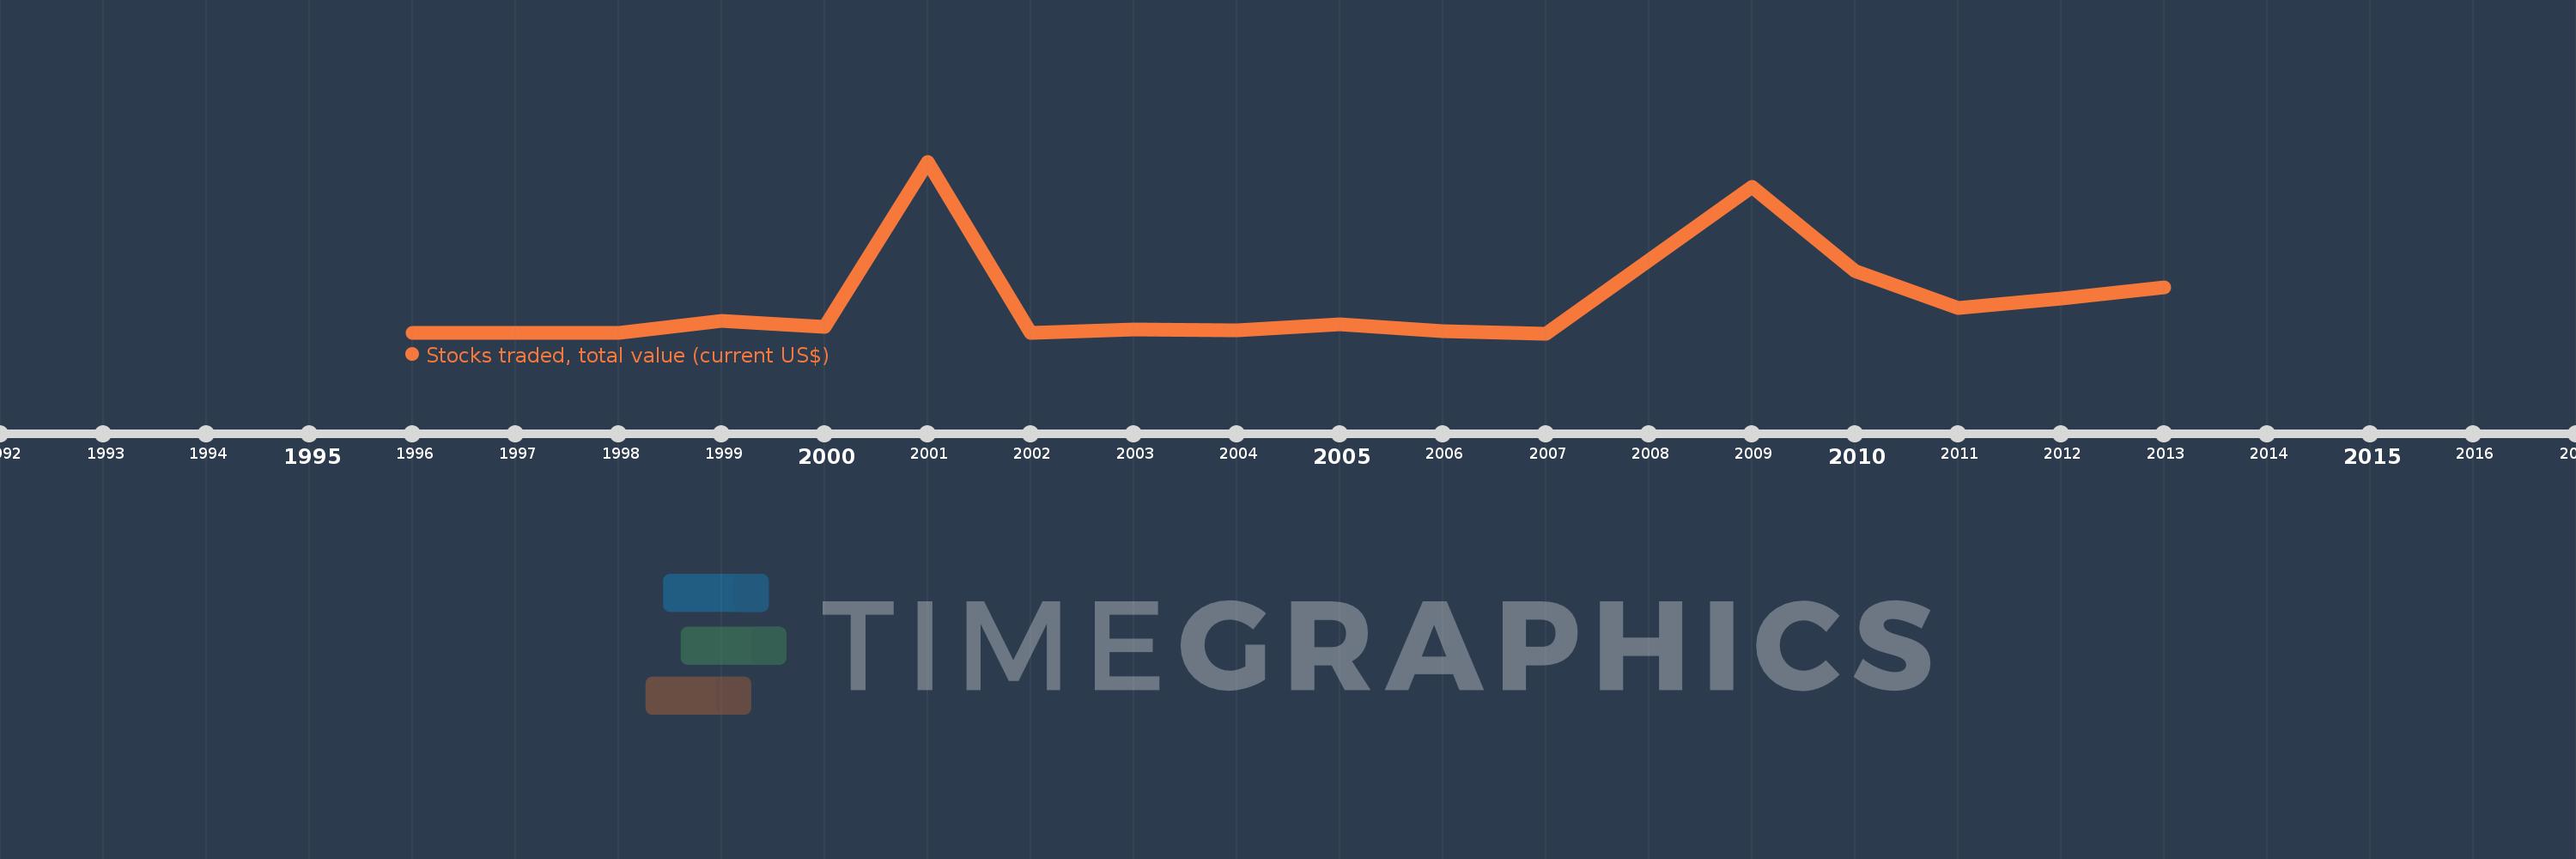
Cette échelle de temps montre un graphique de 1996 année à 2013 année Bolivia. Les données jusqu'à 1995 année ne sont pas présentés. Quantité d'observations actuelles selon dates: 17.

Source (désignation):

Les indicateurs du développement mondiale

Source (organisation):

World Federation of Exchanges database.

Catégories:

Financial Sector

Dernière mise à jour

23 avr. 2017

Les indicateurs de changement de valeurs selon les années

En moyenne:
13.265 mln.
Minimum:
942.326 milles
1 janv. 2007
Maximum:
69.531 mln.
1 janv. 2001
Pour la date d''observation
Valeur
Changement absolu
Le changement par rapport à la valeur précédente
1 janv. 1996
1000.0 milles
+1000.0 milles
0.0%
1 janv. 1997
1000.0 milles
0.0
0.0%
1 janv. 1998
1000.0 milles
0.0
0.0%
1 janv. 1999
6.0 mln.
+5.0 mln.
500.0%
1 janv. 2000
3.348 mln.
-2.652 mln.
-44.19%
1 janv. 2001
69.531 mln.
+66.183 mln.
1.98 milles%
1 janv. 2002
1.272 mln.
-68.259 mln.
-98.17%
1 janv. 2003
2.39 mln.
+1.117 mln.
87.84%
1 janv. 2004
2.236 mln.
-153.126 milles
-6.41%
1 janv. 2005
4.472 mln.
+2.235 mln.
99.94%
1 janv. 2006
1.698 mln.
-2.774 mln.
-62.02%
1 janv. 2007
942.326 milles
-755.822 milles
-44.51%
1 janv. 2009
59.43 mln.
+58.488 mln.
6.21 milles%
1 janv. 2010
25.91 mln.
-33.52 mln.
-56.4%
1 janv. 2011
11.0 mln.
-14.91 mln.
-57.55%
1 janv. 2012
14.94 mln.
+3.94 mln.
35.82%
1 janv. 2013
19.34 mln.
+4.4 mln.
29.45%

Classement des pays selon les statistiques actuelles par années