30
/fr/
AIzaSyAYiBZKx7MnpbEhh9jyipgxe19OcubqV5w
April 1, 2024
115389
Croatia
HRV
true
2
1
Stocks traded, total value (current US$)
2014,2013,2012,2011,2010,2009,2008,2007,2006,2005,2004,2003,2002,2001,2000,1999,1998,1997,1996,1995,1994
Download
Bibliothèque de statistiques globales →Croatia →

Stocks traded, total value (current US$)

Cette statistique dans les autres pays:

Arab WorldArgentinaArmeniaAustraliaAustriaBahrainBangladeshBarbadosBelgiumBermudaBoliviaBotswanaBrazilBulgariaCanadaCayman IslandsCentral Europe and the BalticsChannel IslandsChileChinaColombiaCosta RicaCote d'IvoireCroatiaCyprusCzech RepublicDenmarkEarly-demographic dividendEast Asia & PacificEast Asia & Pacific (excluding high income)East Asia & Pacific (IDA & IBRD countries)EcuadorEgypt, Arab Rep.El SalvadorEstoniaEuro areaEurope & Central AsiaEurope & Central Asia (excluding high income)Europe & Central Asia (IDA & IBRD countries)European UnionFijiFinlandFranceGeorgiaGermanyGhanaGreeceGuyanaHigh incomeHong Kong SAR, ChinaHungaryIBRD onlyIcelandIDA & IBRD totalIDA blendIDA totalIndiaIndonesiaIran, Islamic Rep.IrelandIsraelItalyJamaicaJapanJordanKazakhstanKenyaKorea, Rep.KuwaitKyrgyz RepublicLate-demographic dividendLatin America & Caribbean Latin America & Caribbean (excluding high income)Latin America & the Caribbean (IDA & IBRD countries)LatviaLebanonLithuaniaLow & middle incomeLower middle incomeLuxembourgMacedonia, FYRMalawiMalaysiaMaltaMauritiusMexicoMiddle East & North AfricaMiddle East & North Africa (excluding high income)Middle East & North Africa (IDA & IBRD countries)Middle incomeMoldovaMongoliaMontenegroMoroccoNamibiaNetherlandsNew ZealandNigeriaNorth AmericaNorwayOECD membersOmanOther small statesPakistanPanamaPapua New GuineaParaguayPeruPhilippinesPolandPortugalPost-demographic dividendQatarRomaniaRussian FederationSaudi ArabiaSerbiaSeychellesSingaporeSlovak RepublicSloveniaSouth AfricaSouth AsiaSouth Asia (IDA & IBRD)SpainSri LankaSt. Kitts and NevisSub-Saharan Africa Sub-Saharan Africa (excluding high income)Sub-Saharan Africa (IDA & IBRD countries)SwazilandSwedenSwitzerlandTanzaniaThailandTrinidad and TobagoTunisiaTurkeyUgandaUkraineUnited Arab EmiratesUnited KingdomUnited StatesUpper middle incomeUruguayUzbekistanVenezuela, RBVietnamWest Bank and GazaWorldZambiaZimbabwe

La ligne de temps

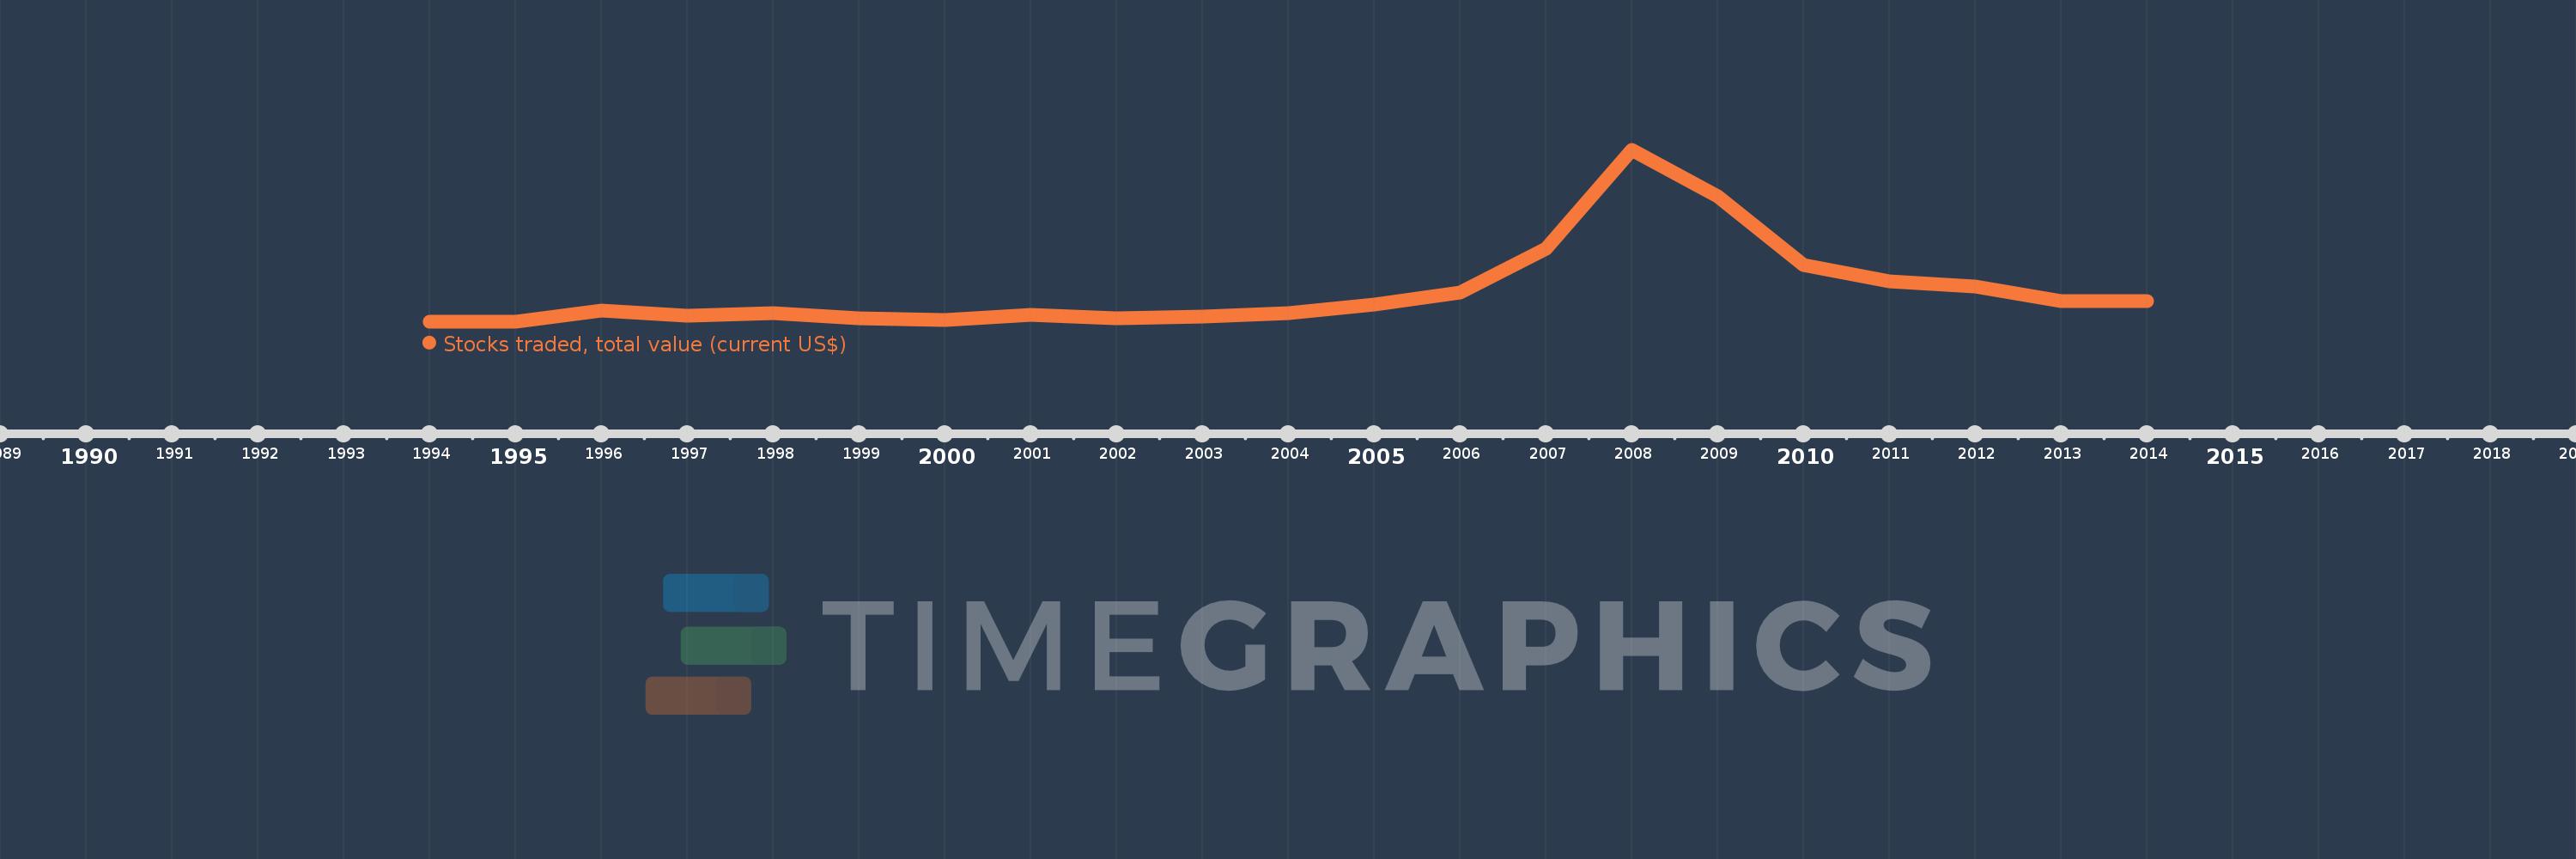
Cette échelle de temps montre un graphique de 1994 année à 2014 année Croatia. Les données jusqu'à 1993 année ne sont pas présentés. Quantité d'observations actuelles selon dates: 21.

Source (désignation):

Les indicateurs du développement mondiale

Source (organisation):

World Federation of Exchanges database.

Catégories:

Financial Sector

Dernière mise à jour

23 avr. 2017

Les indicateurs de changement de valeurs selon les années

En moyenne:
803.396 mln.
Minimum:
13.2 mln.
1 janv. 1994
Maximum:
4.386 mds
1 janv. 2008
Pour la date d''observation
Valeur
Changement absolu
Le changement par rapport à la valeur précédente
1 janv. 1994
13.2 mln.
+13.2 mln.
0.0%
1 janv. 1995
13.2 mln.
0.0
0.0%
1 janv. 1996
308.0 mln.
+294.8 mln.
2.23 milles%
1 janv. 1997
178.72 mln.
-129.28 mln.
-41.97%
1 janv. 1998
242.36 mln.
+63.64 mln.
35.61%
1 janv. 1999
100.04 mln.
-142.32 mln.
-58.72%
1 janv. 2000
68.81 mln.
-31.23 mln.
-31.22%
1 janv. 2001
189.23 mln.
+120.42 mln.
175.0%
1 janv. 2002
115.9 mln.
-73.33 mln.
-38.75%
1 janv. 2003
160.17 mln.
+44.27 mln.
38.2%
1 janv. 2004
246.53 mln.
+86.36 mln.
53.92%
1 janv. 2005
464.98 mln.
+218.45 mln.
88.61%
1 janv. 2006
756.92 mln.
+291.94 mln.
62.79%
1 janv. 2007
1.876 mds
+1.119 mds
147.87%
1 janv. 2008
4.386 mds
+2.51 mds
133.78%
1 janv. 2009
3.216 mds
-1.17 mds
-26.68%
1 janv. 2010
1.462 mds
-1.754 mds
-54.54%
1 janv. 2011
1.05 mds
-412.04 mln.
-28.19%
1 janv. 2012
926.79 mln.
-123.06 mln.
-11.72%
1 janv. 2013
542.7 mln.
-384.09 mln.
-41.44%
1 janv. 2014
553.8 mln.
+11.1 mln.
2.05%

Classement des pays selon les statistiques actuelles par années