33
/fr/
AIzaSyAYiBZKx7MnpbEhh9jyipgxe19OcubqV5w
August 1, 2025
242135
Slovak Republic
SVK
true
2
1
Stocks traded, total value (current US$)
2014,2013,2012,2011,2010,2009,2008,2007,2006,2005,2004,2003,2002,2001,2000,1999,1998,1997,1996,1995,1994
Download
Bibliothèque de statistiques globales →Slovak Republic →

Stocks traded, total value (current US$)

Cette statistique dans les autres pays:

Arab WorldArgentinaArmeniaAustraliaAustriaBahrainBangladeshBarbadosBelgiumBermudaBoliviaBotswanaBrazilBulgariaCanadaCayman IslandsCentral Europe and the BalticsChannel IslandsChileChinaColombiaCosta RicaCote d'IvoireCroatiaCyprusCzech RepublicDenmarkEarly-demographic dividendEast Asia & PacificEast Asia & Pacific (excluding high income)East Asia & Pacific (IDA & IBRD countries)EcuadorEgypt, Arab Rep.El SalvadorEstoniaEuro areaEurope & Central AsiaEurope & Central Asia (excluding high income)Europe & Central Asia (IDA & IBRD countries)European UnionFijiFinlandFranceGeorgiaGermanyGhanaGreeceGuyanaHigh incomeHong Kong SAR, ChinaHungaryIBRD onlyIcelandIDA & IBRD totalIDA blendIDA totalIndiaIndonesiaIran, Islamic Rep.IrelandIsraelItalyJamaicaJapanJordanKazakhstanKenyaKorea, Rep.KuwaitKyrgyz RepublicLate-demographic dividendLatin America & Caribbean Latin America & Caribbean (excluding high income)Latin America & the Caribbean (IDA & IBRD countries)LatviaLebanonLithuaniaLow & middle incomeLower middle incomeLuxembourgMacedonia, FYRMalawiMalaysiaMaltaMauritiusMexicoMiddle East & North AfricaMiddle East & North Africa (excluding high income)Middle East & North Africa (IDA & IBRD countries)Middle incomeMoldovaMongoliaMontenegroMoroccoNamibiaNetherlandsNew ZealandNigeriaNorth AmericaNorwayOECD membersOmanOther small statesPakistanPanamaPapua New GuineaParaguayPeruPhilippinesPolandPortugalPost-demographic dividendQatarRomaniaRussian FederationSaudi ArabiaSerbiaSeychellesSingaporeSlovak RepublicSloveniaSouth AfricaSouth AsiaSouth Asia (IDA & IBRD)SpainSri LankaSt. Kitts and NevisSub-Saharan Africa Sub-Saharan Africa (excluding high income)Sub-Saharan Africa (IDA & IBRD countries)SwazilandSwedenSwitzerlandTanzaniaThailandTrinidad and TobagoTunisiaTurkeyUgandaUkraineUnited Arab EmiratesUnited KingdomUnited StatesUpper middle incomeUruguayUzbekistanVenezuela, RBVietnamWest Bank and GazaWorldZambiaZimbabwe

La ligne de temps

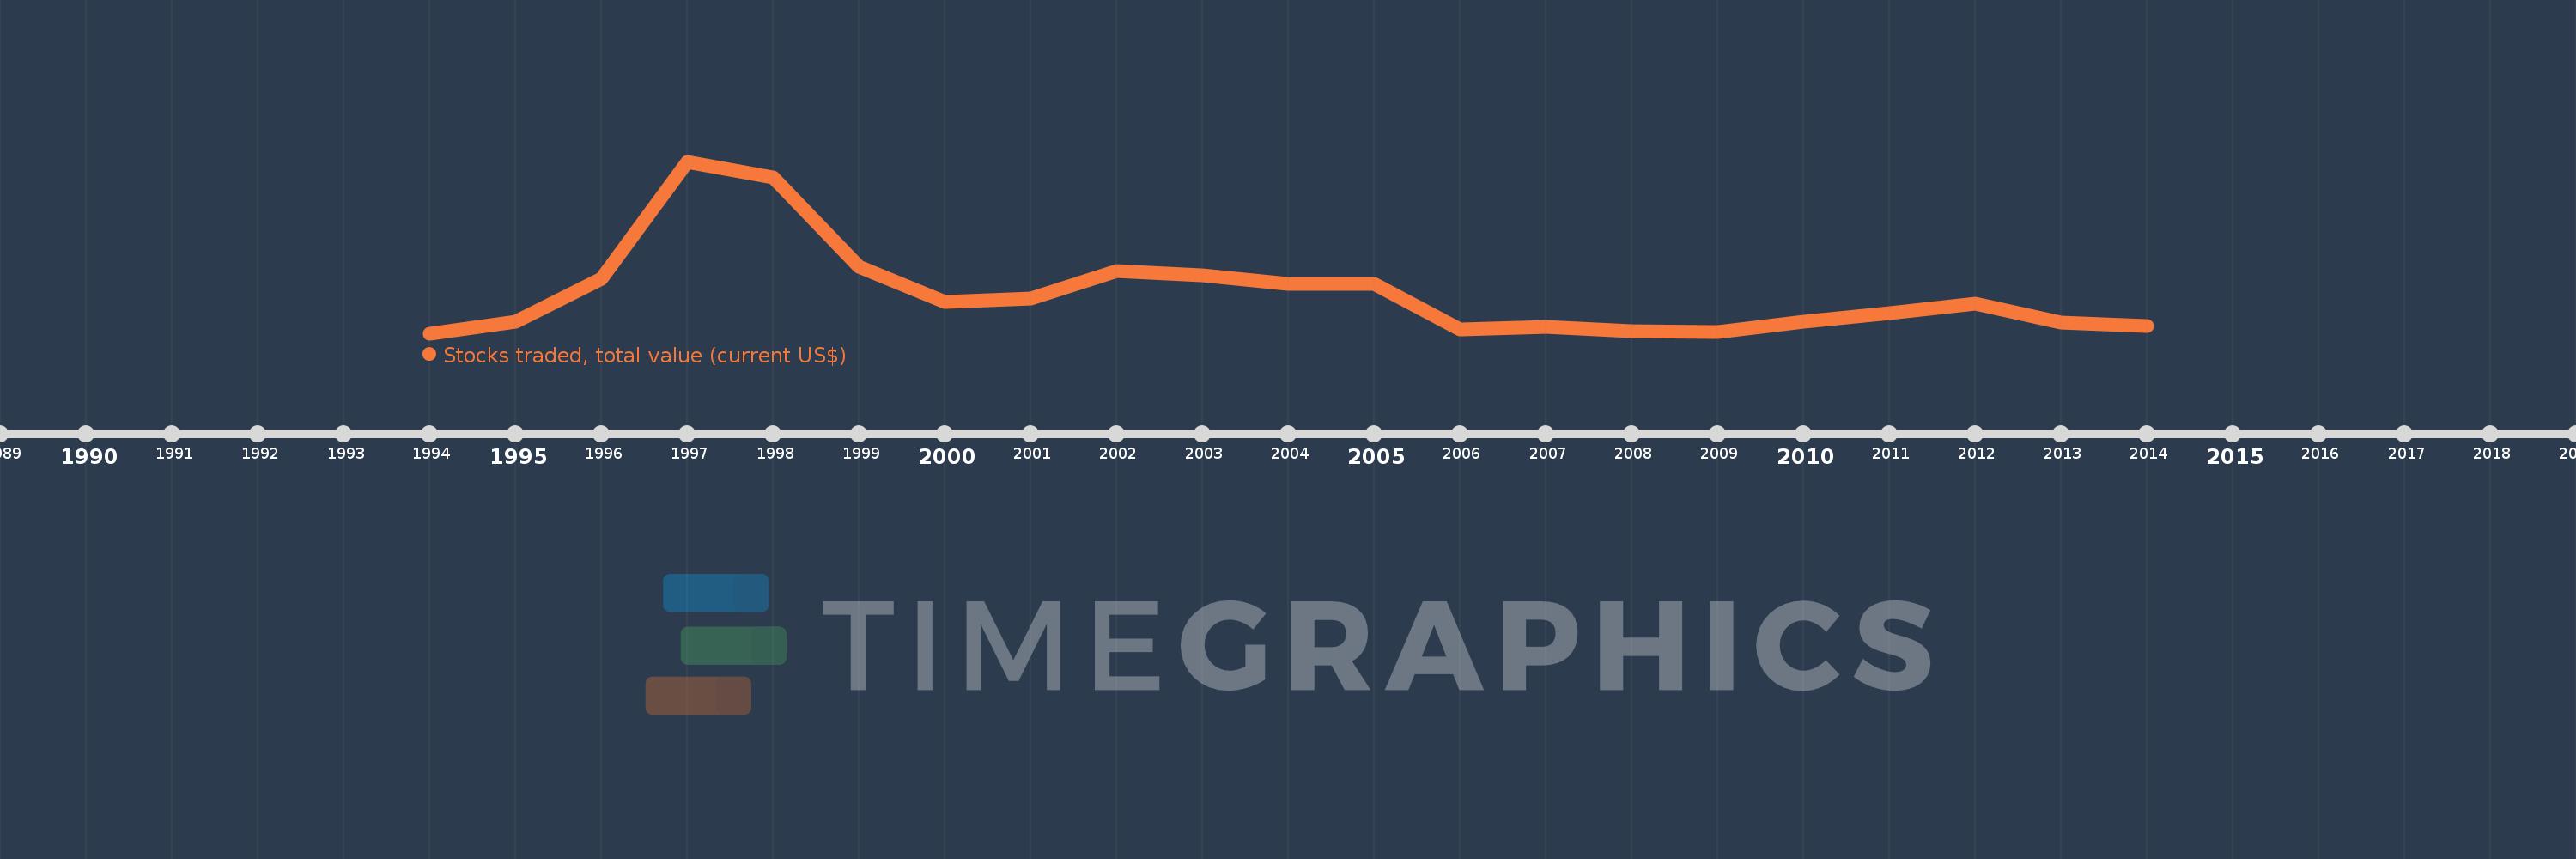
Cette échelle de temps montre un graphique de 1994 année à 2014 année Slovak Republic. Les données jusqu'à 1993 année ne sont pas présentés. Quantité d'observations actuelles selon dates: 21.

Source (désignation):

Les indicateurs du développement mondiale

Source (organisation):

World Federation of Exchanges database.

Catégories:

Financial Sector

Dernière mise à jour

23 avr. 2017

Les indicateurs de changement de valeurs selon les années

En moyenne:
608.287 mln.
Minimum:
2.7 mln.
1 janv. 1994
Maximum:
2.607 mds
1 janv. 1997
Pour la date d''observation
Valeur
Changement absolu
Le changement par rapport à la valeur précédente
1 janv. 1994
2.7 mln.
+2.7 mln.
0.0%
1 janv. 1995
174.7 mln.
+172.0 mln.
6.37 milles%
1 janv. 1996
834.7 mln.
+660.0 mln.
377.79%
1 janv. 1997
2.607 mds
+1.772 mds
212.34%
1 janv. 1998
2.369 mds
-238.3 mln.
-9.14%
1 janv. 1999
1.012 mds
-1.357 mds
-57.28%
1 janv. 2000
478.0 mln.
-534.0 mln.
-52.77%
1 janv. 2001
534.0 mln.
+56.0 mln.
11.72%
1 janv. 2002
953.2 mln.
+419.2 mln.
78.5%
1 janv. 2003
880.9 mln.
-72.3 mln.
-7.58%
1 janv. 2004
746.5 mln.
-134.4 mln.
-15.26%
1 janv. 2005
750.5 mln.
+4.0 mln.
0.54%
1 janv. 2006
66.4 mln.
-684.1 mln.
-91.15%
1 janv. 2007
99.5 mln.
+33.1 mln.
49.85%
1 janv. 2008
31.27 mln.
-68.23 mln.
-68.57%
1 janv. 2009
21.08 mln.
-10.19 mln.
-32.59%
1 janv. 2010
174.68 mln.
+153.6 mln.
728.65%
1 janv. 2011
308.92 mln.
+134.24 mln.
76.85%
1 janv. 2012
452.81 mln.
+143.89 mln.
46.58%
1 janv. 2013
166.64 mln.
-286.17 mln.
-63.2%
1 janv. 2014
109.62 mln.
-57.02 mln.
-34.22%

Classement des pays selon les statistiques actuelles par années