29
/fr/
fr
AIzaSyAYiBZKx7MnpbEhh9jyipgxe19OcubqV5w
April 1, 2024
199884
Mongolia
MNG
true
2
1
Stocks traded, total value (current US$)
2013,2012,2011,2010,2009,2008,2007,2006,2005,2004,2003,2002,2001,2000,1999,1998,1997,1996
Download
Bibliothèque de statistiques globales →Mongolia →

Stocks traded, total value (current US$)

Cette statistique dans les autres pays:
Arab WorldArgentinaArmeniaAustraliaAustriaBahrainBangladeshBarbadosBelgiumBermudaBoliviaBotswanaBrazilBulgariaCanadaCayman IslandsCentral Europe and the BalticsChannel IslandsChileChinaColombiaCosta RicaCote d'IvoireCroatiaCyprusCzech RepublicDenmarkEarly-demographic dividendEast Asia & PacificEast Asia & Pacific (excluding high income)East Asia & Pacific (IDA & IBRD countries)EcuadorEgypt, Arab Rep.El SalvadorEstoniaEuro areaEurope & Central AsiaEurope & Central Asia (excluding high income)Europe & Central Asia (IDA & IBRD countries)European UnionFijiFinlandFranceGeorgiaGermanyGhanaGreeceGuyanaHigh incomeHong Kong SAR, ChinaHungaryIBRD onlyIcelandIDA & IBRD totalIDA blendIDA totalIndiaIndonesiaIran, Islamic Rep.IrelandIsraelItalyJamaicaJapanJordanKazakhstanKenyaKorea, Rep.KuwaitKyrgyz RepublicLate-demographic dividendLatin America & Caribbean Latin America & Caribbean (excluding high income)Latin America & the Caribbean (IDA & IBRD countries)LatviaLebanonLithuaniaLow & middle incomeLower middle incomeLuxembourgMacedonia, FYRMalawiMalaysiaMaltaMauritiusMexicoMiddle East & North AfricaMiddle East & North Africa (excluding high income)Middle East & North Africa (IDA & IBRD countries)Middle incomeMoldovaMongoliaMontenegroMoroccoNamibiaNetherlandsNew ZealandNigeriaNorth AmericaNorwayOECD membersOmanOther small statesPakistanPanamaPapua New GuineaParaguayPeruPhilippinesPolandPortugalPost-demographic dividendQatarRomaniaRussian FederationSaudi ArabiaSerbiaSeychellesSingaporeSlovak RepublicSloveniaSouth AfricaSouth AsiaSouth Asia (IDA & IBRD)SpainSri LankaSt. Kitts and NevisSub-Saharan Africa Sub-Saharan Africa (excluding high income)Sub-Saharan Africa (IDA & IBRD countries)SwazilandSwedenSwitzerlandTanzaniaThailandTrinidad and TobagoTunisiaTurkeyUgandaUkraineUnited Arab EmiratesUnited KingdomUnited StatesUpper middle incomeUruguayUzbekistanVenezuela, RBVietnamWest Bank and GazaWorldZambiaZimbabwe
La ligne de temps
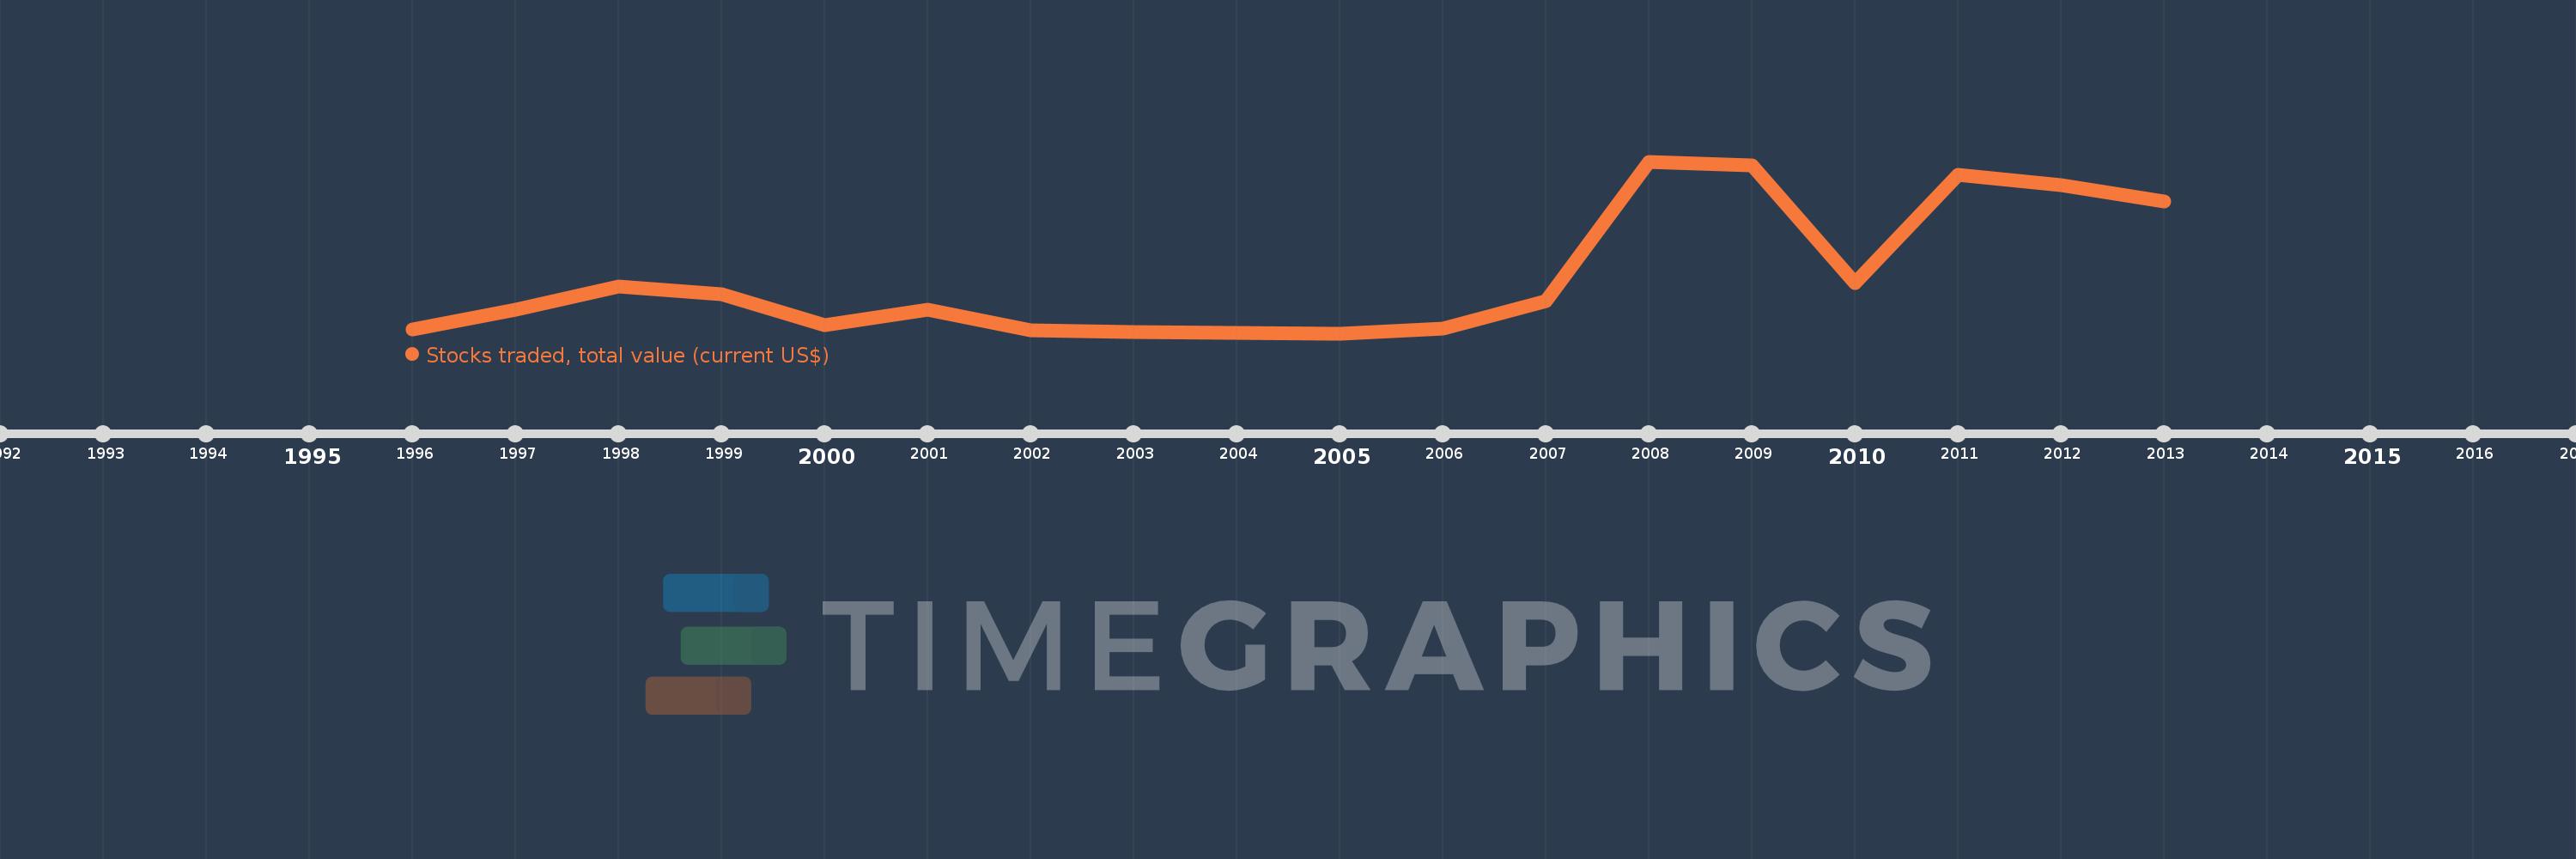
Cette échelle de temps montre un graphique de 1996 année à 2013 année Mongolia. Les données jusqu'à 1995 année ne sont pas présentés. Quantité d'observations actuelles selon dates: 18.
Source (désignation):
Les indicateurs du développement mondiale
Source (organisation):
World Federation of Exchanges database.
Catégories:
Financial Sector
Dernière mise à jour
23 avr. 2017
Les indicateurs de changement de valeurs selon les années
En moyenne:
17.949 mln.
Minimum:
780.0 milles
1 janv. 2005
Maximum:
53.118 mln.
1 janv. 2008
Pour la date d''observation
Valeur
Changement absolu
Le changement par rapport à la valeur précédente
1 janv. 1996
2.0 mln.
+2.0 mln.
0.0%
1 janv. 1997
8.0 mln.
+6.0 mln.
300.0%
1 janv. 1998
15.0 mln.
+7.0 mln.
87.5%
1 janv. 1999
12.79 mln.
-2.21 mln.
-14.73%
1 janv. 2000
3.204 mln.
-9.586 mln.
-74.95%
1 janv. 2001
8.0 mln.
+4.796 mln.
149.69%
1 janv. 2002
1.6 mln.
-6.4 mln.
-80.0%
1 janv. 2003
1.2 mln.
-400.0 milles
-25.0%
1 janv. 2004
800.0 milles
-400.0 milles
-33.33%
1 janv. 2005
780.0 milles
-20.0 milles
-2.5%
1 janv. 2006
2.162 mln.
+1.382 mln.
177.18%
1 janv. 2007
10.689 mln.
+8.527 mln.
394.4%
1 janv. 2008
53.118 mln.
+42.429 mln.
396.94%
1 janv. 2009
51.965 mln.
-1.152 mln.
-2.17%
1 janv. 2010
16.07 mln.
-35.896 mln.
-69.08%
1 janv. 2011
49.0 mln.
+32.93 mln.
204.92%
1 janv. 2012
45.806 mln.
-3.194 mln.
-6.52%
1 janv. 2013
40.892 mln.
-4.914 mln.
-10.73%
Classement des pays selon les statistiques actuelles par années

Commentaires:

Envoyer
PremiumAbout & FeedbackUn accordConfidentialité
logo
© 2022 Selected Technologies LLC – Morgan Hill, California