29
/fr/
fr
AIzaSyAYiBZKx7MnpbEhh9jyipgxe19OcubqV5w
April 1, 2024
77640
Bahrain
BHR
true
2
1
Stocks traded, total value (current US$)
2016,2015,2014,2013,2012,2011,2010,2009,2008,2007,2006,2005,2004,2002,2001,2000,1999,1998,1997,1996,1995
Download
Bibliothèque de statistiques globales →Bahrain →

Stocks traded, total value (current US$)

Cette statistique dans les autres pays:
Arab WorldArgentinaArmeniaAustraliaAustriaBahrainBangladeshBarbadosBelgiumBermudaBoliviaBotswanaBrazilBulgariaCanadaCayman IslandsCentral Europe and the BalticsChannel IslandsChileChinaColombiaCosta RicaCote d'IvoireCroatiaCyprusCzech RepublicDenmarkEarly-demographic dividendEast Asia & PacificEast Asia & Pacific (excluding high income)East Asia & Pacific (IDA & IBRD countries)EcuadorEgypt, Arab Rep.El SalvadorEstoniaEuro areaEurope & Central AsiaEurope & Central Asia (excluding high income)Europe & Central Asia (IDA & IBRD countries)European UnionFijiFinlandFranceGeorgiaGermanyGhanaGreeceGuyanaHigh incomeHong Kong SAR, ChinaHungaryIBRD onlyIcelandIDA & IBRD totalIDA blendIDA totalIndiaIndonesiaIran, Islamic Rep.IrelandIsraelItalyJamaicaJapanJordanKazakhstanKenyaKorea, Rep.KuwaitKyrgyz RepublicLate-demographic dividendLatin America & Caribbean Latin America & Caribbean (excluding high income)Latin America & the Caribbean (IDA & IBRD countries)LatviaLebanonLithuaniaLow & middle incomeLower middle incomeLuxembourgMacedonia, FYRMalawiMalaysiaMaltaMauritiusMexicoMiddle East & North AfricaMiddle East & North Africa (excluding high income)Middle East & North Africa (IDA & IBRD countries)Middle incomeMoldovaMongoliaMontenegroMoroccoNamibiaNetherlandsNew ZealandNigeriaNorth AmericaNorwayOECD membersOmanOther small statesPakistanPanamaPapua New GuineaParaguayPeruPhilippinesPolandPortugalPost-demographic dividendQatarRomaniaRussian FederationSaudi ArabiaSerbiaSeychellesSingaporeSlovak RepublicSloveniaSouth AfricaSouth AsiaSouth Asia (IDA & IBRD)SpainSri LankaSt. Kitts and NevisSub-Saharan Africa Sub-Saharan Africa (excluding high income)Sub-Saharan Africa (IDA & IBRD countries)SwazilandSwedenSwitzerlandTanzaniaThailandTrinidad and TobagoTunisiaTurkeyUgandaUkraineUnited Arab EmiratesUnited KingdomUnited StatesUpper middle incomeUruguayUzbekistanVenezuela, RBVietnamWest Bank and GazaWorldZambiaZimbabwe
La ligne de temps
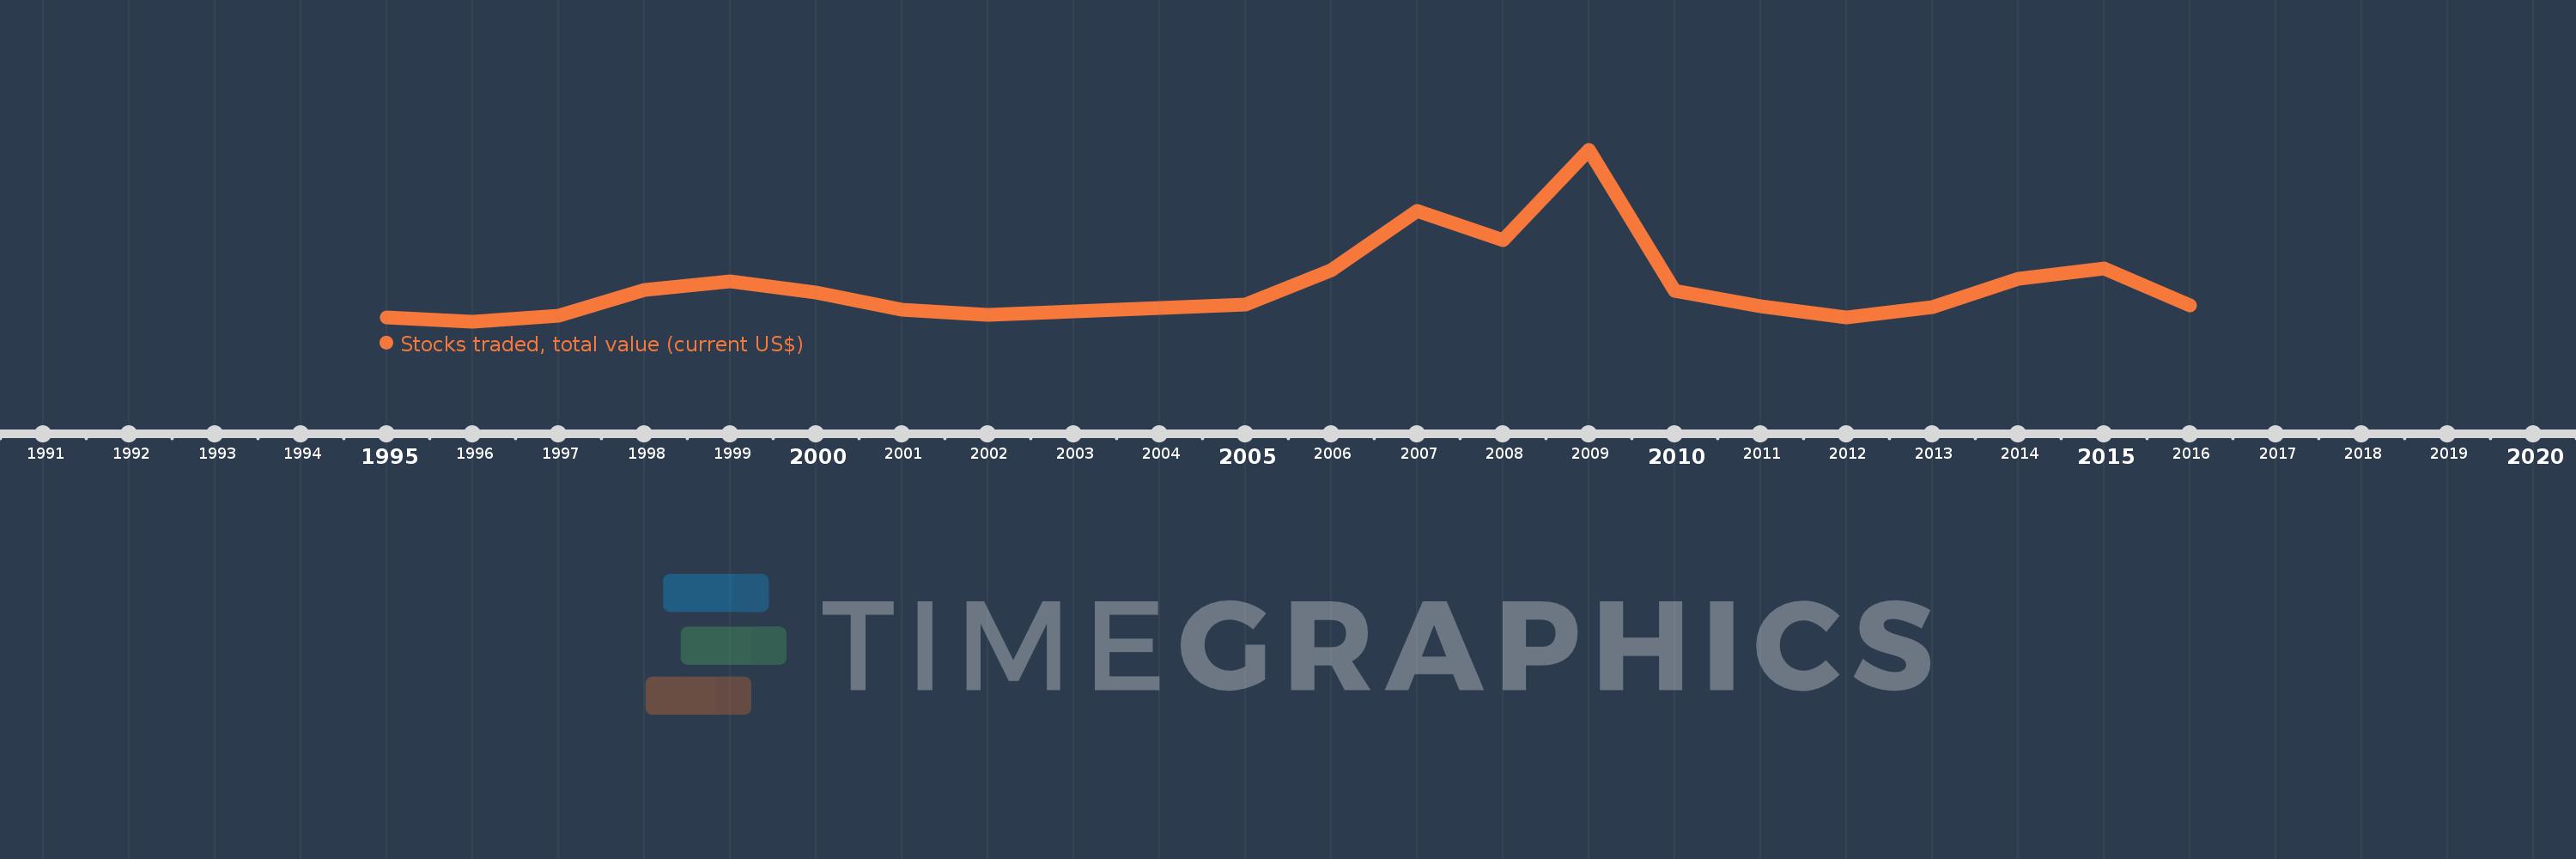
Cette échelle de temps montre un graphique de 1995 année à 2016 année Bahrain. Les données jusqu'à 1994 année ne sont pas présentés. Quantité d'observations actuelles selon dates: 21.
Source (désignation):
Les indicateurs du développement mondiale
Source (organisation):
World Federation of Exchanges database.
Catégories:
Financial Sector
Dernière mise à jour
23 avr. 2017
Les indicateurs de changement de valeurs selon les années
En moyenne:
522.674 mln.
Minimum:
106.1 mln.
1 janv. 1996
Maximum:
2.084 mds
1 janv. 2009
Pour la date d''observation
Valeur
Changement absolu
Le changement par rapport à la valeur précédente
1 janv. 1995
160.2 mln.
+160.2 mln.
0.0%
1 janv. 1996
106.1 mln.
-54.1 mln.
-33.77%
1 janv. 1997
176.7 mln.
+70.6 mln.
66.54%
1 janv. 1998
479.5 mln.
+302.8 mln.
171.36%
1 janv. 1999
576.39 mln.
+96.89 mln.
20.21%
1 janv. 2000
445.39 mln.
-131.0 mln.
-22.73%
1 janv. 2001
245.44 mln.
-199.95 mln.
-44.89%
1 janv. 2002
191.5 mln.
-53.94 mln.
-21.98%
1 janv. 2004
266.73 mln.
+75.23 mln.
39.28%
1 janv. 2005
311.64 mln.
+44.91 mln.
16.84%
1 janv. 2006
702.29 mln.
+390.65 mln.
125.35%
1 janv. 2007
1.381 mds
+678.83 mln.
96.66%
1 janv. 2008
1.045 mds
-336.4 mln.
-24.36%
1 janv. 2009
2.084 mds
+1.039 mds
99.44%
1 janv. 2010
466.28 mln.
-1.617 mds
-77.62%
1 janv. 2011
287.56 mln.
-178.72 mln.
-38.33%
1 janv. 2012
156.13 mln.
-131.43 mln.
-45.71%
1 janv. 2013
278.4 mln.
+122.27 mln.
78.31%
1 janv. 2014
604.6 mln.
+326.2 mln.
117.17%
1 janv. 2015
717.8 mln.
+113.2 mln.
18.72%
1 janv. 2016
294.04 mln.
-423.76 mln.
-59.04%
Classement des pays selon les statistiques actuelles par années

Commentaires:

Envoyer
PremiumAbout & FeedbackUn accordConfidentialité
logo
© 2022 Selected Technologies LLC – Morgan Hill, California