33
/fr/
AIzaSyAYiBZKx7MnpbEhh9jyipgxe19OcubqV5w
May 1, 2025
213691
Nigeria
NGA
true
2
1
Stocks traded, total value (current US$)
2016,2015,2014,2013,2012,2011,2010,2009,2008,2007,2006,2005,2002,2000,1999,1998,1997,1996,1995,1994
Download
Bibliothèque de statistiques globales →Nigeria →

Stocks traded, total value (current US$)

Cette statistique dans les autres pays:

Arab WorldArgentinaArmeniaAustraliaAustriaBahrainBangladeshBarbadosBelgiumBermudaBoliviaBotswanaBrazilBulgariaCanadaCayman IslandsCentral Europe and the BalticsChannel IslandsChileChinaColombiaCosta RicaCote d'IvoireCroatiaCyprusCzech RepublicDenmarkEarly-demographic dividendEast Asia & PacificEast Asia & Pacific (excluding high income)East Asia & Pacific (IDA & IBRD countries)EcuadorEgypt, Arab Rep.El SalvadorEstoniaEuro areaEurope & Central AsiaEurope & Central Asia (excluding high income)Europe & Central Asia (IDA & IBRD countries)European UnionFijiFinlandFranceGeorgiaGermanyGhanaGreeceGuyanaHigh incomeHong Kong SAR, ChinaHungaryIBRD onlyIcelandIDA & IBRD totalIDA blendIDA totalIndiaIndonesiaIran, Islamic Rep.IrelandIsraelItalyJamaicaJapanJordanKazakhstanKenyaKorea, Rep.KuwaitKyrgyz RepublicLate-demographic dividendLatin America & Caribbean Latin America & Caribbean (excluding high income)Latin America & the Caribbean (IDA & IBRD countries)LatviaLebanonLithuaniaLow & middle incomeLower middle incomeLuxembourgMacedonia, FYRMalawiMalaysiaMaltaMauritiusMexicoMiddle East & North AfricaMiddle East & North Africa (excluding high income)Middle East & North Africa (IDA & IBRD countries)Middle incomeMoldovaMongoliaMontenegroMoroccoNamibiaNetherlandsNew ZealandNigeriaNorth AmericaNorwayOECD membersOmanOther small statesPakistanPanamaPapua New GuineaParaguayPeruPhilippinesPolandPortugalPost-demographic dividendQatarRomaniaRussian FederationSaudi ArabiaSerbiaSeychellesSingaporeSlovak RepublicSloveniaSouth AfricaSouth AsiaSouth Asia (IDA & IBRD)SpainSri LankaSt. Kitts and NevisSub-Saharan Africa Sub-Saharan Africa (excluding high income)Sub-Saharan Africa (IDA & IBRD countries)SwazilandSwedenSwitzerlandTanzaniaThailandTrinidad and TobagoTunisiaTurkeyUgandaUkraineUnited Arab EmiratesUnited KingdomUnited StatesUpper middle incomeUruguayUzbekistanVenezuela, RBVietnamWest Bank and GazaWorldZambiaZimbabwe

La ligne de temps

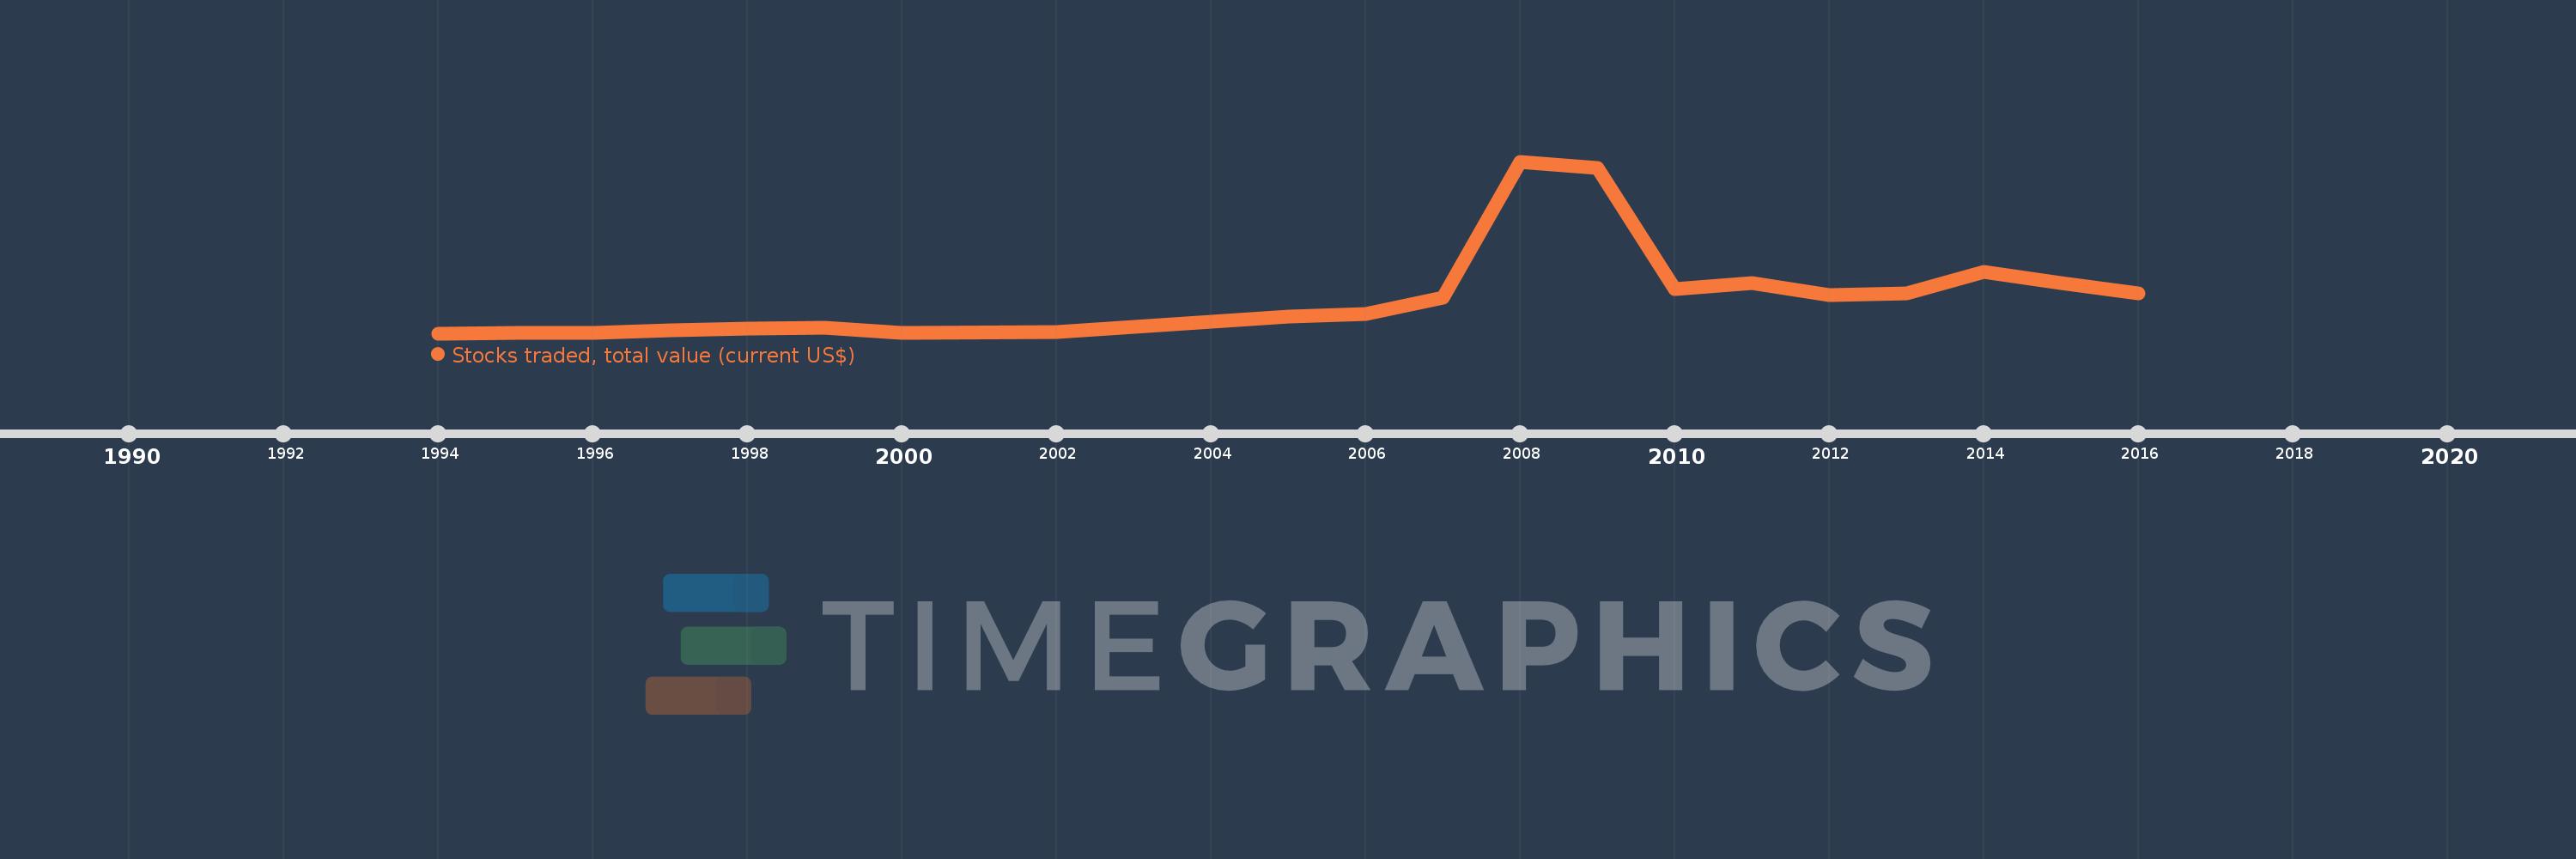
Cette échelle de temps montre un graphique de 1994 année à 2016 année Nigeria. Les données jusqu'à 1993 année ne sont pas présentés. Quantité d'observations actuelles selon dates: 20.

Source (désignation):

Les indicateurs du développement mondiale

Source (organisation):

World Federation of Exchanges database.

Catégories:

Financial Sector

Dernière mise à jour

23 avr. 2017

Les indicateurs de changement de valeurs selon les années

En moyenne:
3.809 mds
Minimum:
30.2 mln.
1 janv. 1994
Maximum:
17.36 mds
1 janv. 2008
Pour la date d''observation
Valeur
Changement absolu
Le changement par rapport à la valeur précédente
1 janv. 1994
30.2 mln.
+30.2 mln.
0.0%
1 janv. 1995
44.8 mln.
+14.6 mln.
48.34%
1 janv. 1996
83.58 mln.
+38.78 mln.
86.56%
1 janv. 1997
314.62 mln.
+231.04 mln.
276.43%
1 janv. 1998
499.03 mln.
+184.41 mln.
58.61%
1 janv. 1999
609.52 mln.
+110.49 mln.
22.14%
1 janv. 2000
112.6 mln.
-496.92 mln.
-81.53%
1 janv. 2002
169.2 mln.
+56.6 mln.
50.27%
1 janv. 2005
1.681 mds
+1.511 mds
893.28%
1 janv. 2006
1.954 mds
+273.14 mln.
16.25%
1 janv. 2007
3.598 mds
+1.644 mds
84.14%
1 janv. 2008
17.36 mds
+13.762 mds
382.54%
1 janv. 2009
16.719 mds
-641.27 mln.
-3.69%
1 janv. 2010
4.493 mds
-12.226 mds
-73.13%
1 janv. 2011
5.105 mds
+612.43 mln.
13.63%
1 janv. 2012
3.872 mds
-1.233 mds
-24.16%
1 janv. 2013
4.093 mds
+220.87 mln.
5.7%
1 janv. 2014
6.228 mds
+2.135 mds
52.17%
1 janv. 2015
5.133 mds
-1.095 mds
-17.58%
1 janv. 2016
4.085 mds
-1.048 mds
-20.42%

Classement des pays selon les statistiques actuelles par années