33
/fr/
AIzaSyAYiBZKx7MnpbEhh9jyipgxe19OcubqV5w
August 1, 2025
168237
Kenya
KEN
true
2
1
Stocks traded, total value (current US$)
2014,2013,2012,2011,2010,2009,2008,2007,2006,2005,2004,2003,2002,2001,2000,1999,1998,1997,1996,1995,1994
Download
Bibliothèque de statistiques globales →Kenya →

Stocks traded, total value (current US$)

Cette statistique dans les autres pays:

Arab WorldArgentinaArmeniaAustraliaAustriaBahrainBangladeshBarbadosBelgiumBermudaBoliviaBotswanaBrazilBulgariaCanadaCayman IslandsCentral Europe and the BalticsChannel IslandsChileChinaColombiaCosta RicaCote d'IvoireCroatiaCyprusCzech RepublicDenmarkEarly-demographic dividendEast Asia & PacificEast Asia & Pacific (excluding high income)East Asia & Pacific (IDA & IBRD countries)EcuadorEgypt, Arab Rep.El SalvadorEstoniaEuro areaEurope & Central AsiaEurope & Central Asia (excluding high income)Europe & Central Asia (IDA & IBRD countries)European UnionFijiFinlandFranceGeorgiaGermanyGhanaGreeceGuyanaHigh incomeHong Kong SAR, ChinaHungaryIBRD onlyIcelandIDA & IBRD totalIDA blendIDA totalIndiaIndonesiaIran, Islamic Rep.IrelandIsraelItalyJamaicaJapanJordanKazakhstanKenyaKorea, Rep.KuwaitKyrgyz RepublicLate-demographic dividendLatin America & Caribbean Latin America & Caribbean (excluding high income)Latin America & the Caribbean (IDA & IBRD countries)LatviaLebanonLithuaniaLow & middle incomeLower middle incomeLuxembourgMacedonia, FYRMalawiMalaysiaMaltaMauritiusMexicoMiddle East & North AfricaMiddle East & North Africa (excluding high income)Middle East & North Africa (IDA & IBRD countries)Middle incomeMoldovaMongoliaMontenegroMoroccoNamibiaNetherlandsNew ZealandNigeriaNorth AmericaNorwayOECD membersOmanOther small statesPakistanPanamaPapua New GuineaParaguayPeruPhilippinesPolandPortugalPost-demographic dividendQatarRomaniaRussian FederationSaudi ArabiaSerbiaSeychellesSingaporeSlovak RepublicSloveniaSouth AfricaSouth AsiaSouth Asia (IDA & IBRD)SpainSri LankaSt. Kitts and NevisSub-Saharan Africa Sub-Saharan Africa (excluding high income)Sub-Saharan Africa (IDA & IBRD countries)SwazilandSwedenSwitzerlandTanzaniaThailandTrinidad and TobagoTunisiaTurkeyUgandaUkraineUnited Arab EmiratesUnited KingdomUnited StatesUpper middle incomeUruguayUzbekistanVenezuela, RBVietnamWest Bank and GazaWorldZambiaZimbabwe

La ligne de temps

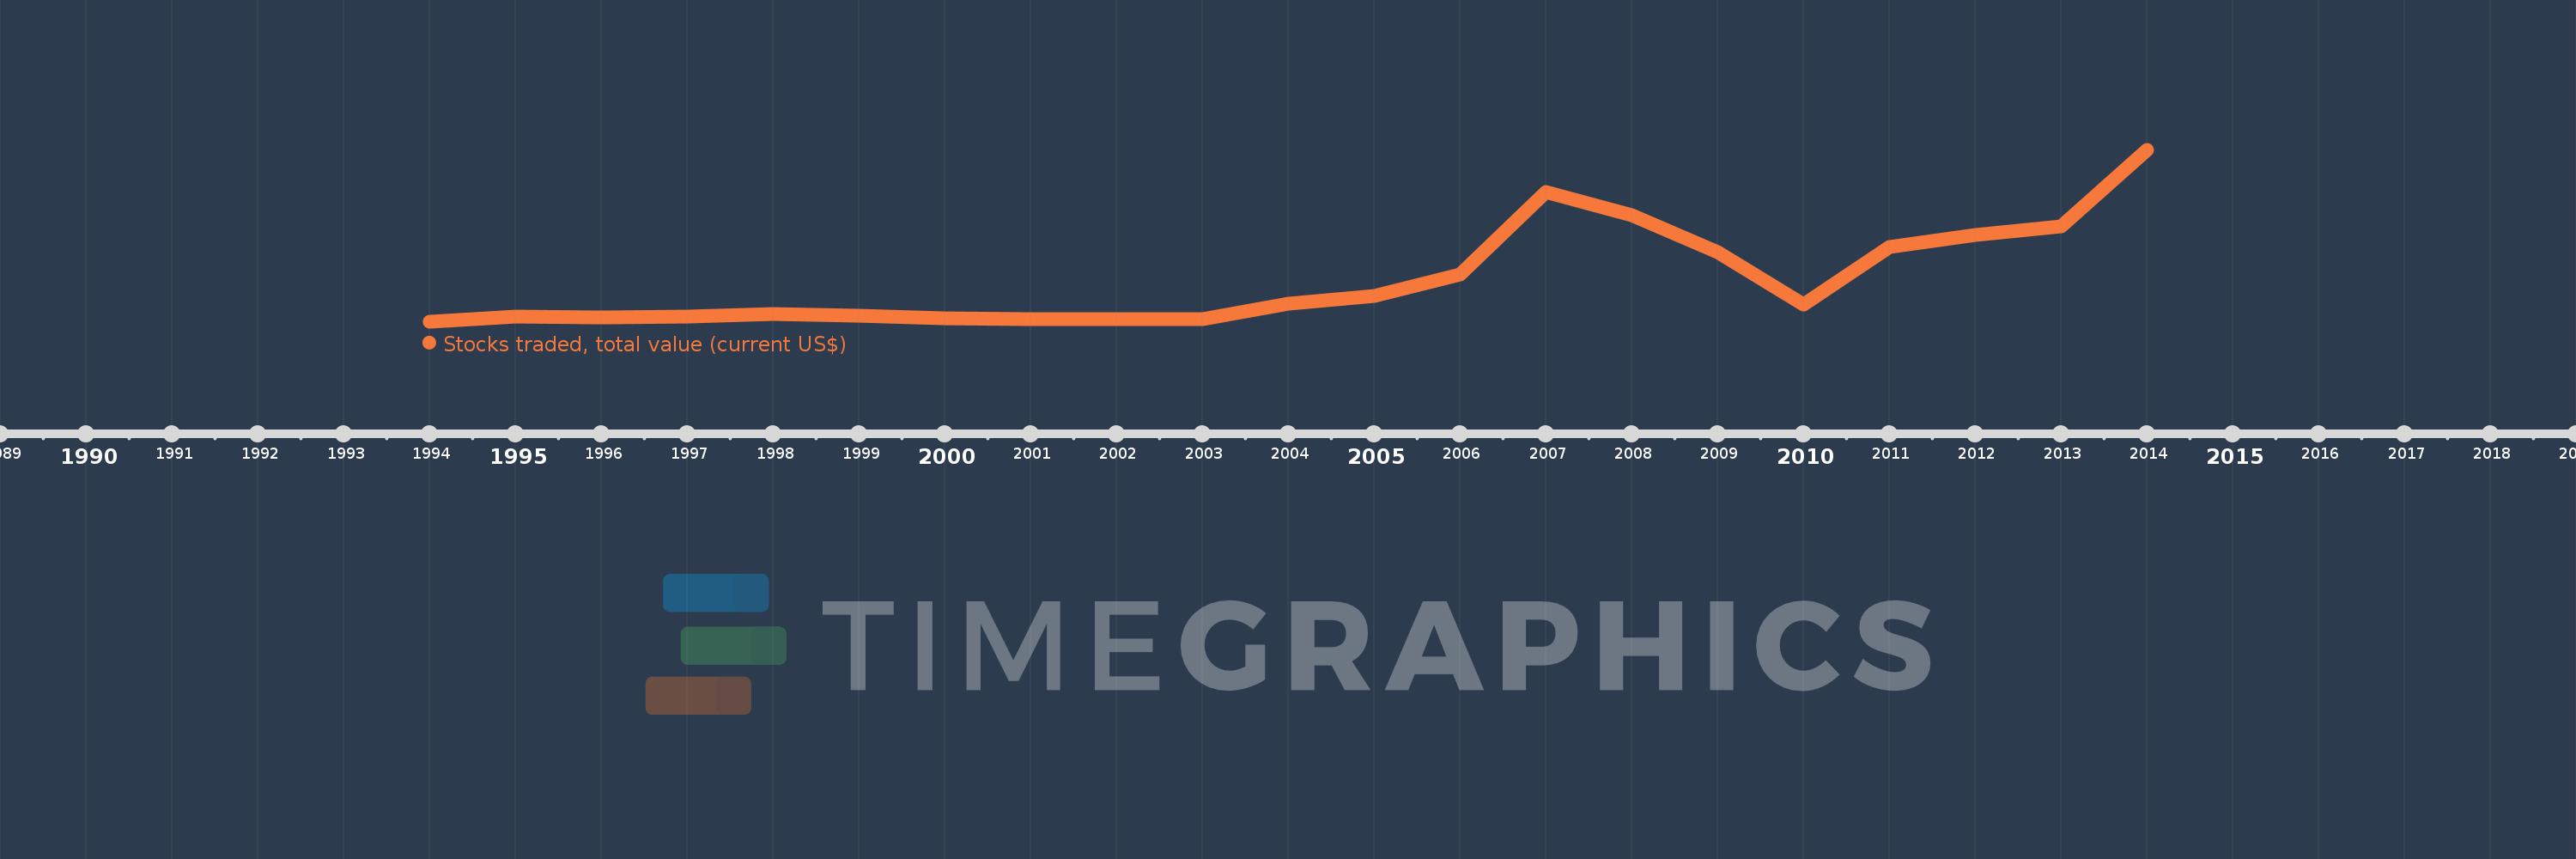
Cette échelle de temps montre un graphique de 1994 année à 2014 année Kenya. Les données jusqu'à 1993 année ne sont pas présentés. Quantité d'observations actuelles selon dates: 21.

Source (désignation):

Les indicateurs du développement mondiale

Source (organisation):

World Federation of Exchanges database.

Catégories:

Financial Sector

Dernière mise à jour

23 avr. 2017

Les indicateurs de changement de valeurs selon les années

En moyenne:
451.93 mln.
Minimum:
12.1 mln.
1 janv. 1994
Maximum:
1.805 mds
1 janv. 2014
Pour la date d''observation
Valeur
Changement absolu
Le changement par rapport à la valeur précédente
1 janv. 1994
12.1 mln.
+12.1 mln.
0.0%
1 janv. 1995
68.6 mln.
+56.5 mln.
466.94%
1 janv. 1996
59.85 mln.
-8.75 mln.
-12.76%
1 janv. 1997
71.18 mln.
+11.33 mln.
18.93%
1 janv. 1998
97.49 mln.
+26.31 mln.
36.96%
1 janv. 1999
74.2 mln.
-23.29 mln.
-23.89%
1 janv. 2000
48.5 mln.
-25.7 mln.
-34.64%
1 janv. 2001
37.8 mln.
-10.7 mln.
-22.06%
1 janv. 2002
39.3 mln.
+1.5 mln.
3.97%
1 janv. 2003
37.38 mln.
-1.92 mln.
-4.89%
1 janv. 2004
200.0 mln.
+162.62 mln.
435.05%
1 janv. 2005
283.84 mln.
+83.84 mln.
41.92%
1 janv. 2006
504.12 mln.
+220.28 mln.
77.61%
1 janv. 2007
1.364 mds
+860.15 mln.
170.62%
1 janv. 2008
1.128 mds
-236.5 mln.
-17.34%
1 janv. 2009
742.2 mln.
-385.57 mln.
-34.19%
1 janv. 2010
198.34 mln.
-543.86 mln.
-73.28%
1 janv. 2011
793.53 mln.
+595.19 mln.
300.09%
1 janv. 2012
917.25 mln.
+123.72 mln.
15.59%
1 janv. 2013
1.008 mds
+90.85 mln.
9.9%
1 janv. 2014
1.805 mds
+796.6 mln.
79.02%

Classement des pays selon les statistiques actuelles par années