33
/fr/
AIzaSyAYiBZKx7MnpbEhh9jyipgxe19OcubqV5w
August 1, 2025
132679
Fiji
FJI
true
2
1
Stocks traded, total value (current US$)
2013,2012,2011,2010,2009,2008,2007,2006,2005,2004,2000,1999,1998
Download
Bibliothèque de statistiques globales →Fiji →

Stocks traded, total value (current US$)

Cette statistique dans les autres pays:

Arab WorldArgentinaArmeniaAustraliaAustriaBahrainBangladeshBarbadosBelgiumBermudaBoliviaBotswanaBrazilBulgariaCanadaCayman IslandsCentral Europe and the BalticsChannel IslandsChileChinaColombiaCosta RicaCote d'IvoireCroatiaCyprusCzech RepublicDenmarkEarly-demographic dividendEast Asia & PacificEast Asia & Pacific (excluding high income)East Asia & Pacific (IDA & IBRD countries)EcuadorEgypt, Arab Rep.El SalvadorEstoniaEuro areaEurope & Central AsiaEurope & Central Asia (excluding high income)Europe & Central Asia (IDA & IBRD countries)European UnionFijiFinlandFranceGeorgiaGermanyGhanaGreeceGuyanaHigh incomeHong Kong SAR, ChinaHungaryIBRD onlyIcelandIDA & IBRD totalIDA blendIDA totalIndiaIndonesiaIran, Islamic Rep.IrelandIsraelItalyJamaicaJapanJordanKazakhstanKenyaKorea, Rep.KuwaitKyrgyz RepublicLate-demographic dividendLatin America & Caribbean Latin America & Caribbean (excluding high income)Latin America & the Caribbean (IDA & IBRD countries)LatviaLebanonLithuaniaLow & middle incomeLower middle incomeLuxembourgMacedonia, FYRMalawiMalaysiaMaltaMauritiusMexicoMiddle East & North AfricaMiddle East & North Africa (excluding high income)Middle East & North Africa (IDA & IBRD countries)Middle incomeMoldovaMongoliaMontenegroMoroccoNamibiaNetherlandsNew ZealandNigeriaNorth AmericaNorwayOECD membersOmanOther small statesPakistanPanamaPapua New GuineaParaguayPeruPhilippinesPolandPortugalPost-demographic dividendQatarRomaniaRussian FederationSaudi ArabiaSerbiaSeychellesSingaporeSlovak RepublicSloveniaSouth AfricaSouth AsiaSouth Asia (IDA & IBRD)SpainSri LankaSt. Kitts and NevisSub-Saharan Africa Sub-Saharan Africa (excluding high income)Sub-Saharan Africa (IDA & IBRD countries)SwazilandSwedenSwitzerlandTanzaniaThailandTrinidad and TobagoTunisiaTurkeyUgandaUkraineUnited Arab EmiratesUnited KingdomUnited StatesUpper middle incomeUruguayUzbekistanVenezuela, RBVietnamWest Bank and GazaWorldZambiaZimbabwe

La ligne de temps

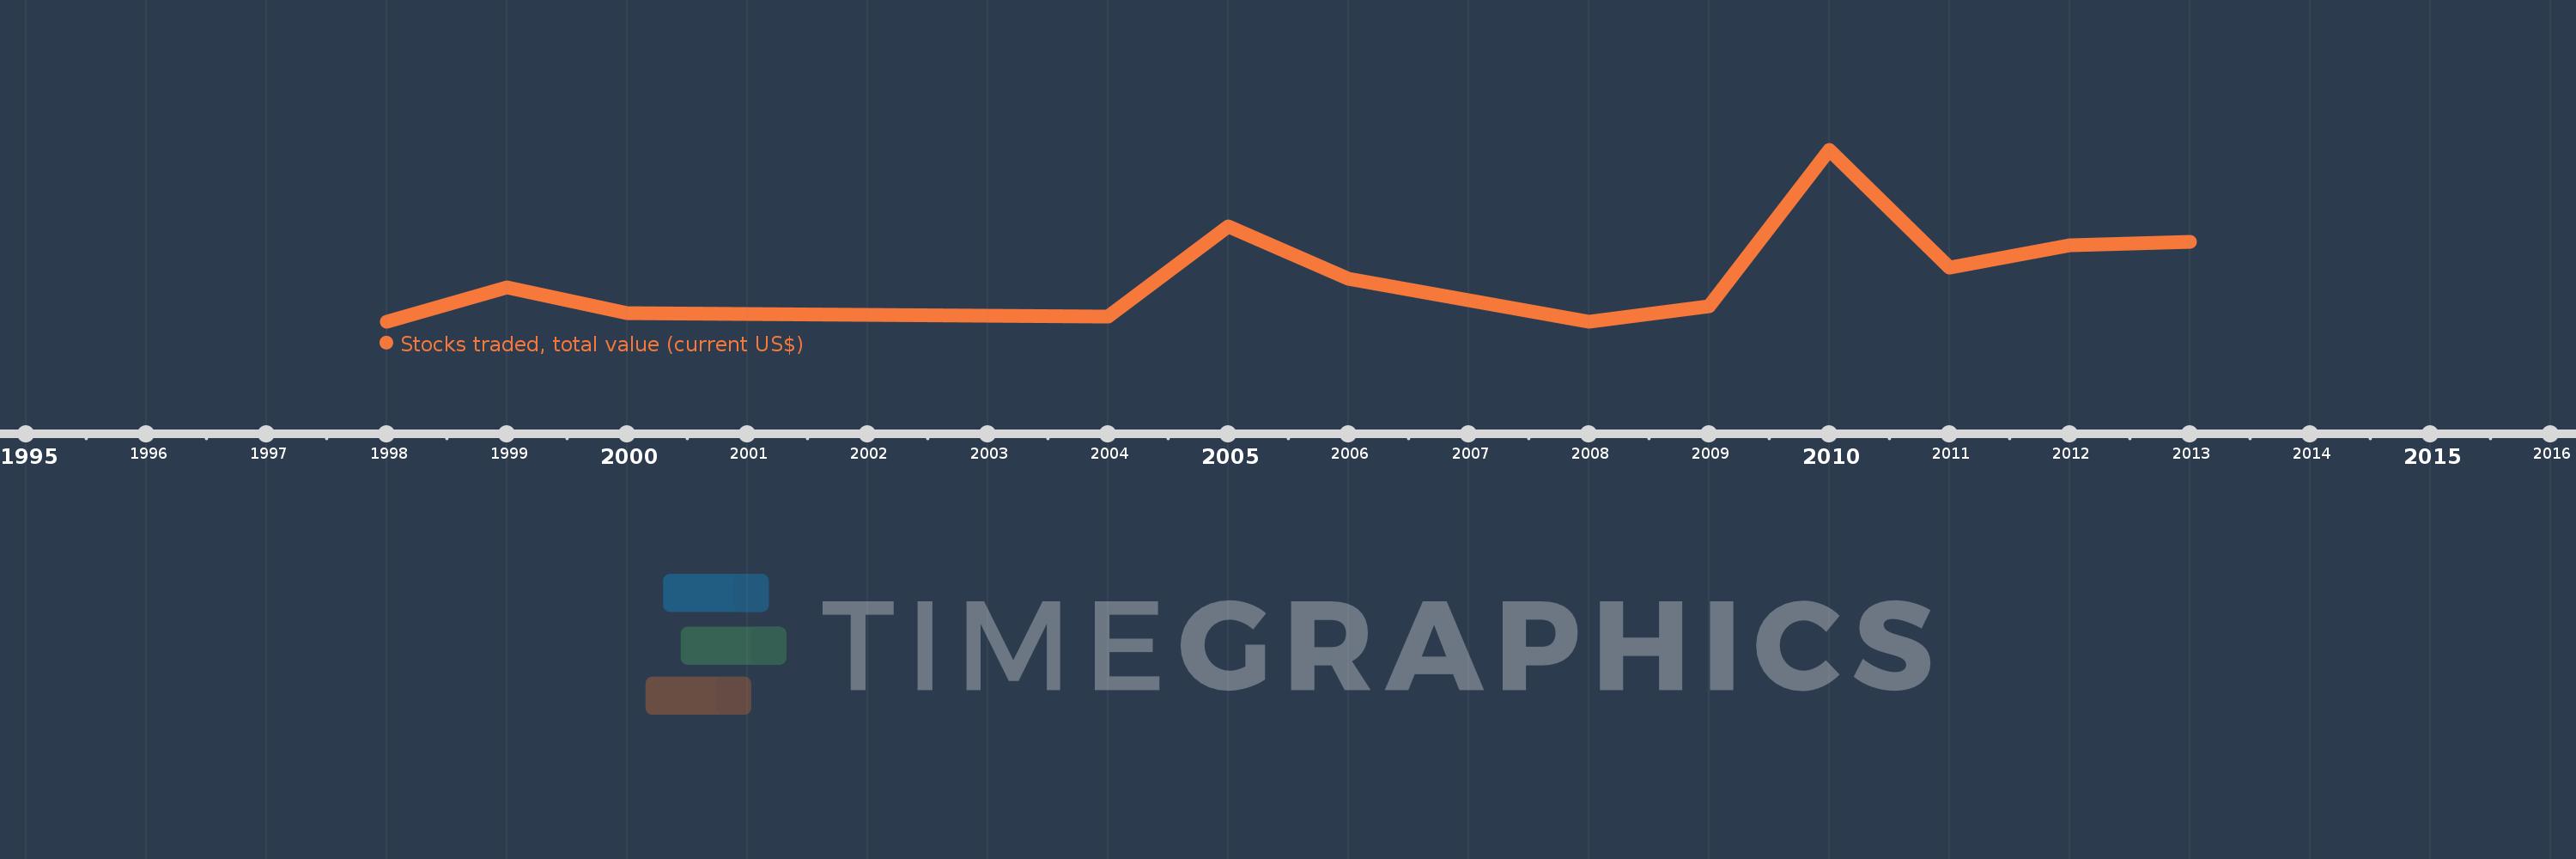
Cette échelle de temps montre un graphique de 1998 année à 2013 année Fiji. Les données jusqu'à 1997 année ne sont pas présentés. Quantité d'observations actuelles selon dates: 13.

Source (désignation):

Les indicateurs du développement mondiale

Source (organisation):

World Federation of Exchanges database.

Catégories:

Financial Sector

Dernière mise à jour

23 avr. 2017

Les indicateurs de changement de valeurs selon les années

En moyenne:
4.694 mln.
Minimum:
2.0 mln.
1 janv. 1998
Maximum:
11.896 mln.
1 janv. 2010
Pour la date d''observation
Valeur
Changement absolu
Le changement par rapport à la valeur précédente
1 janv. 1998
2.0 mln.
+2.0 mln.
0.0%
1 janv. 1999
4.0 mln.
+2.0 mln.
100.0%
1 janv. 2000
2.487 mln.
-1.513 mln.
-37.82%
1 janv. 2004
2.301 mln.
-185.54 milles
-7.46%
1 janv. 2005
7.53 mln.
+5.229 mln.
227.2%
1 janv. 2006
4.474 mln.
-3.056 mln.
-40.59%
1 janv. 2007
3.264 mln.
-1.21 mln.
-27.05%
1 janv. 2008
2.0 mln.
-1.264 mln.
-38.73%
1 janv. 2009
2.89 mln.
+889.702 milles
44.49%
1 janv. 2010
11.896 mln.
+9.007 mln.
311.68%
1 janv. 2011
5.117 mln.
-6.78 mln.
-56.99%
1 janv. 2012
6.442 mln.
+1.325 mln.
25.9%
1 janv. 2013
6.621 mln.
+179.517 milles
2.79%

Classement des pays selon les statistiques actuelles par années