33
/fr/
AIzaSyAYiBZKx7MnpbEhh9jyipgxe19OcubqV5w
August 1, 2025
141143
Ghana
GHA
true
2
1
Stocks traded, total value (current US$)
2014,2013,2012,2011,2010,2009,2008,2007,2006,2005,2004,2003,2002,2001,2000,1999,1998,1997,1996,1995,1994
Download
Bibliothèque de statistiques globales →Ghana →

Stocks traded, total value (current US$)

Cette statistique dans les autres pays:

Arab WorldArgentinaArmeniaAustraliaAustriaBahrainBangladeshBarbadosBelgiumBermudaBoliviaBotswanaBrazilBulgariaCanadaCayman IslandsCentral Europe and the BalticsChannel IslandsChileChinaColombiaCosta RicaCote d'IvoireCroatiaCyprusCzech RepublicDenmarkEarly-demographic dividendEast Asia & PacificEast Asia & Pacific (excluding high income)East Asia & Pacific (IDA & IBRD countries)EcuadorEgypt, Arab Rep.El SalvadorEstoniaEuro areaEurope & Central AsiaEurope & Central Asia (excluding high income)Europe & Central Asia (IDA & IBRD countries)European UnionFijiFinlandFranceGeorgiaGermanyGhanaGreeceGuyanaHigh incomeHong Kong SAR, ChinaHungaryIBRD onlyIcelandIDA & IBRD totalIDA blendIDA totalIndiaIndonesiaIran, Islamic Rep.IrelandIsraelItalyJamaicaJapanJordanKazakhstanKenyaKorea, Rep.KuwaitKyrgyz RepublicLate-demographic dividendLatin America & Caribbean Latin America & Caribbean (excluding high income)Latin America & the Caribbean (IDA & IBRD countries)LatviaLebanonLithuaniaLow & middle incomeLower middle incomeLuxembourgMacedonia, FYRMalawiMalaysiaMaltaMauritiusMexicoMiddle East & North AfricaMiddle East & North Africa (excluding high income)Middle East & North Africa (IDA & IBRD countries)Middle incomeMoldovaMongoliaMontenegroMoroccoNamibiaNetherlandsNew ZealandNigeriaNorth AmericaNorwayOECD membersOmanOther small statesPakistanPanamaPapua New GuineaParaguayPeruPhilippinesPolandPortugalPost-demographic dividendQatarRomaniaRussian FederationSaudi ArabiaSerbiaSeychellesSingaporeSlovak RepublicSloveniaSouth AfricaSouth AsiaSouth Asia (IDA & IBRD)SpainSri LankaSt. Kitts and NevisSub-Saharan Africa Sub-Saharan Africa (excluding high income)Sub-Saharan Africa (IDA & IBRD countries)SwazilandSwedenSwitzerlandTanzaniaThailandTrinidad and TobagoTunisiaTurkeyUgandaUkraineUnited Arab EmiratesUnited KingdomUnited StatesUpper middle incomeUruguayUzbekistanVenezuela, RBVietnamWest Bank and GazaWorldZambiaZimbabwe

La ligne de temps

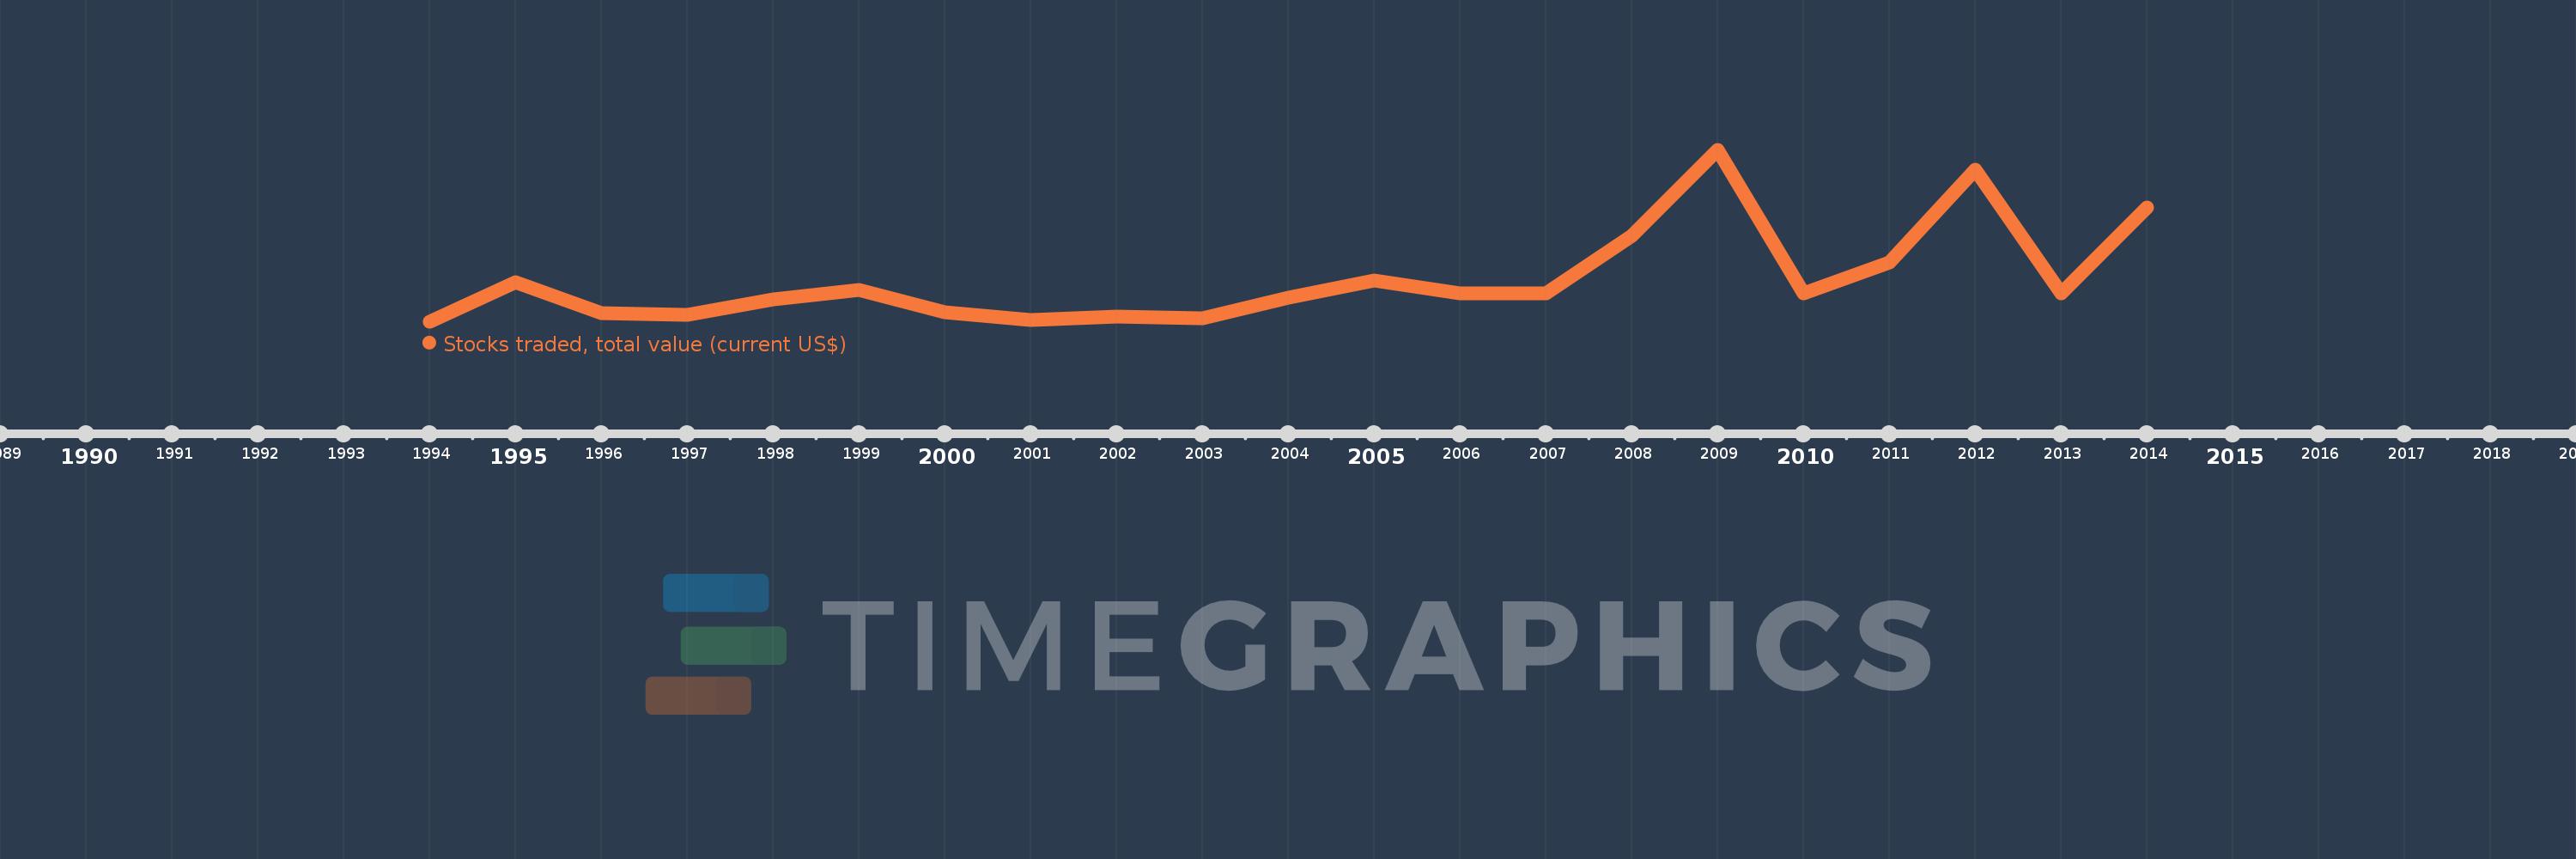
Cette échelle de temps montre un graphique de 1994 année à 2014 année Ghana. Les données jusqu'à 1993 année ne sont pas présentés. Quantité d'observations actuelles selon dates: 21.

Source (désignation):

Les indicateurs du développement mondiale

Source (organisation):

World Federation of Exchanges database.

Catégories:

Financial Sector

Dernière mise à jour

23 avr. 2017

Les indicateurs de changement de valeurs selon les années

En moyenne:
74.252 mln.
Minimum:
4.1 mln.
1 janv. 1994
Maximum:
286.8 mln.
1 janv. 2009
Pour la date d''observation
Valeur
Changement absolu
Le changement par rapport à la valeur précédente
1 janv. 1994
4.1 mln.
+4.1 mln.
0.0%
1 janv. 1995
69.0 mln.
+64.9 mln.
1.58 milles%
1 janv. 1996
18.85 mln.
-50.15 mln.
-72.68%
1 janv. 1997
16.15 mln.
-2.7 mln.
-14.32%
1 janv. 1998
41.31 mln.
+25.16 mln.
155.79%
1 janv. 1999
57.27 mln.
+15.96 mln.
38.63%
1 janv. 2000
19.89 mln.
-37.38 mln.
-65.27%
1 janv. 2001
6.96 mln.
-12.93 mln.
-65.01%
1 janv. 2002
12.5 mln.
+5.54 mln.
79.6%
1 janv. 2003
10.0 mln.
-2.5 mln.
-20.0%
1 janv. 2004
43.99 mln.
+33.99 mln.
339.9%
1 janv. 2005
72.88 mln.
+28.89 mln.
65.67%
1 janv. 2006
51.0 mln.
-21.88 mln.
-30.02%
1 janv. 2007
51.6 mln.
+600.0 milles
1.18%
1 janv. 2008
145.4 mln.
+93.8 mln.
181.78%
1 janv. 2009
286.8 mln.
+141.4 mln.
97.25%
1 janv. 2010
51.8 mln.
-235.0 mln.
-81.94%
1 janv. 2011
101.8 mln.
+50.0 mln.
96.53%
1 janv. 2012
254.1 mln.
+152.3 mln.
149.61%
1 janv. 2013
51.0 mln.
-203.1 mln.
-79.93%
1 janv. 2014
192.9 mln.
+141.9 mln.
278.24%

Classement des pays selon les statistiques actuelles par années