30
/fr/
AIzaSyAYiBZKx7MnpbEhh9jyipgxe19OcubqV5w
April 1, 2024
85458
Bermuda
BMU
true
2
1
Stocks traded, total value (current US$)
2016,2015,2014,2013,2012,2011,2010,2009,2008,2007,2006,2005,2004,2003,2002,2001,2000,1999,1998,1997,1996
Download
Bibliothèque de statistiques globales →Bermuda →

Stocks traded, total value (current US$)

Cette statistique dans les autres pays:

Arab WorldArgentinaArmeniaAustraliaAustriaBahrainBangladeshBarbadosBelgiumBermudaBoliviaBotswanaBrazilBulgariaCanadaCayman IslandsCentral Europe and the BalticsChannel IslandsChileChinaColombiaCosta RicaCote d'IvoireCroatiaCyprusCzech RepublicDenmarkEarly-demographic dividendEast Asia & PacificEast Asia & Pacific (excluding high income)East Asia & Pacific (IDA & IBRD countries)EcuadorEgypt, Arab Rep.El SalvadorEstoniaEuro areaEurope & Central AsiaEurope & Central Asia (excluding high income)Europe & Central Asia (IDA & IBRD countries)European UnionFijiFinlandFranceGeorgiaGermanyGhanaGreeceGuyanaHigh incomeHong Kong SAR, ChinaHungaryIBRD onlyIcelandIDA & IBRD totalIDA blendIDA totalIndiaIndonesiaIran, Islamic Rep.IrelandIsraelItalyJamaicaJapanJordanKazakhstanKenyaKorea, Rep.KuwaitKyrgyz RepublicLate-demographic dividendLatin America & Caribbean Latin America & Caribbean (excluding high income)Latin America & the Caribbean (IDA & IBRD countries)LatviaLebanonLithuaniaLow & middle incomeLower middle incomeLuxembourgMacedonia, FYRMalawiMalaysiaMaltaMauritiusMexicoMiddle East & North AfricaMiddle East & North Africa (excluding high income)Middle East & North Africa (IDA & IBRD countries)Middle incomeMoldovaMongoliaMontenegroMoroccoNamibiaNetherlandsNew ZealandNigeriaNorth AmericaNorwayOECD membersOmanOther small statesPakistanPanamaPapua New GuineaParaguayPeruPhilippinesPolandPortugalPost-demographic dividendQatarRomaniaRussian FederationSaudi ArabiaSerbiaSeychellesSingaporeSlovak RepublicSloveniaSouth AfricaSouth AsiaSouth Asia (IDA & IBRD)SpainSri LankaSt. Kitts and NevisSub-Saharan Africa Sub-Saharan Africa (excluding high income)Sub-Saharan Africa (IDA & IBRD countries)SwazilandSwedenSwitzerlandTanzaniaThailandTrinidad and TobagoTunisiaTurkeyUgandaUkraineUnited Arab EmiratesUnited KingdomUnited StatesUpper middle incomeUruguayUzbekistanVenezuela, RBVietnamWest Bank and GazaWorldZambiaZimbabwe

La ligne de temps

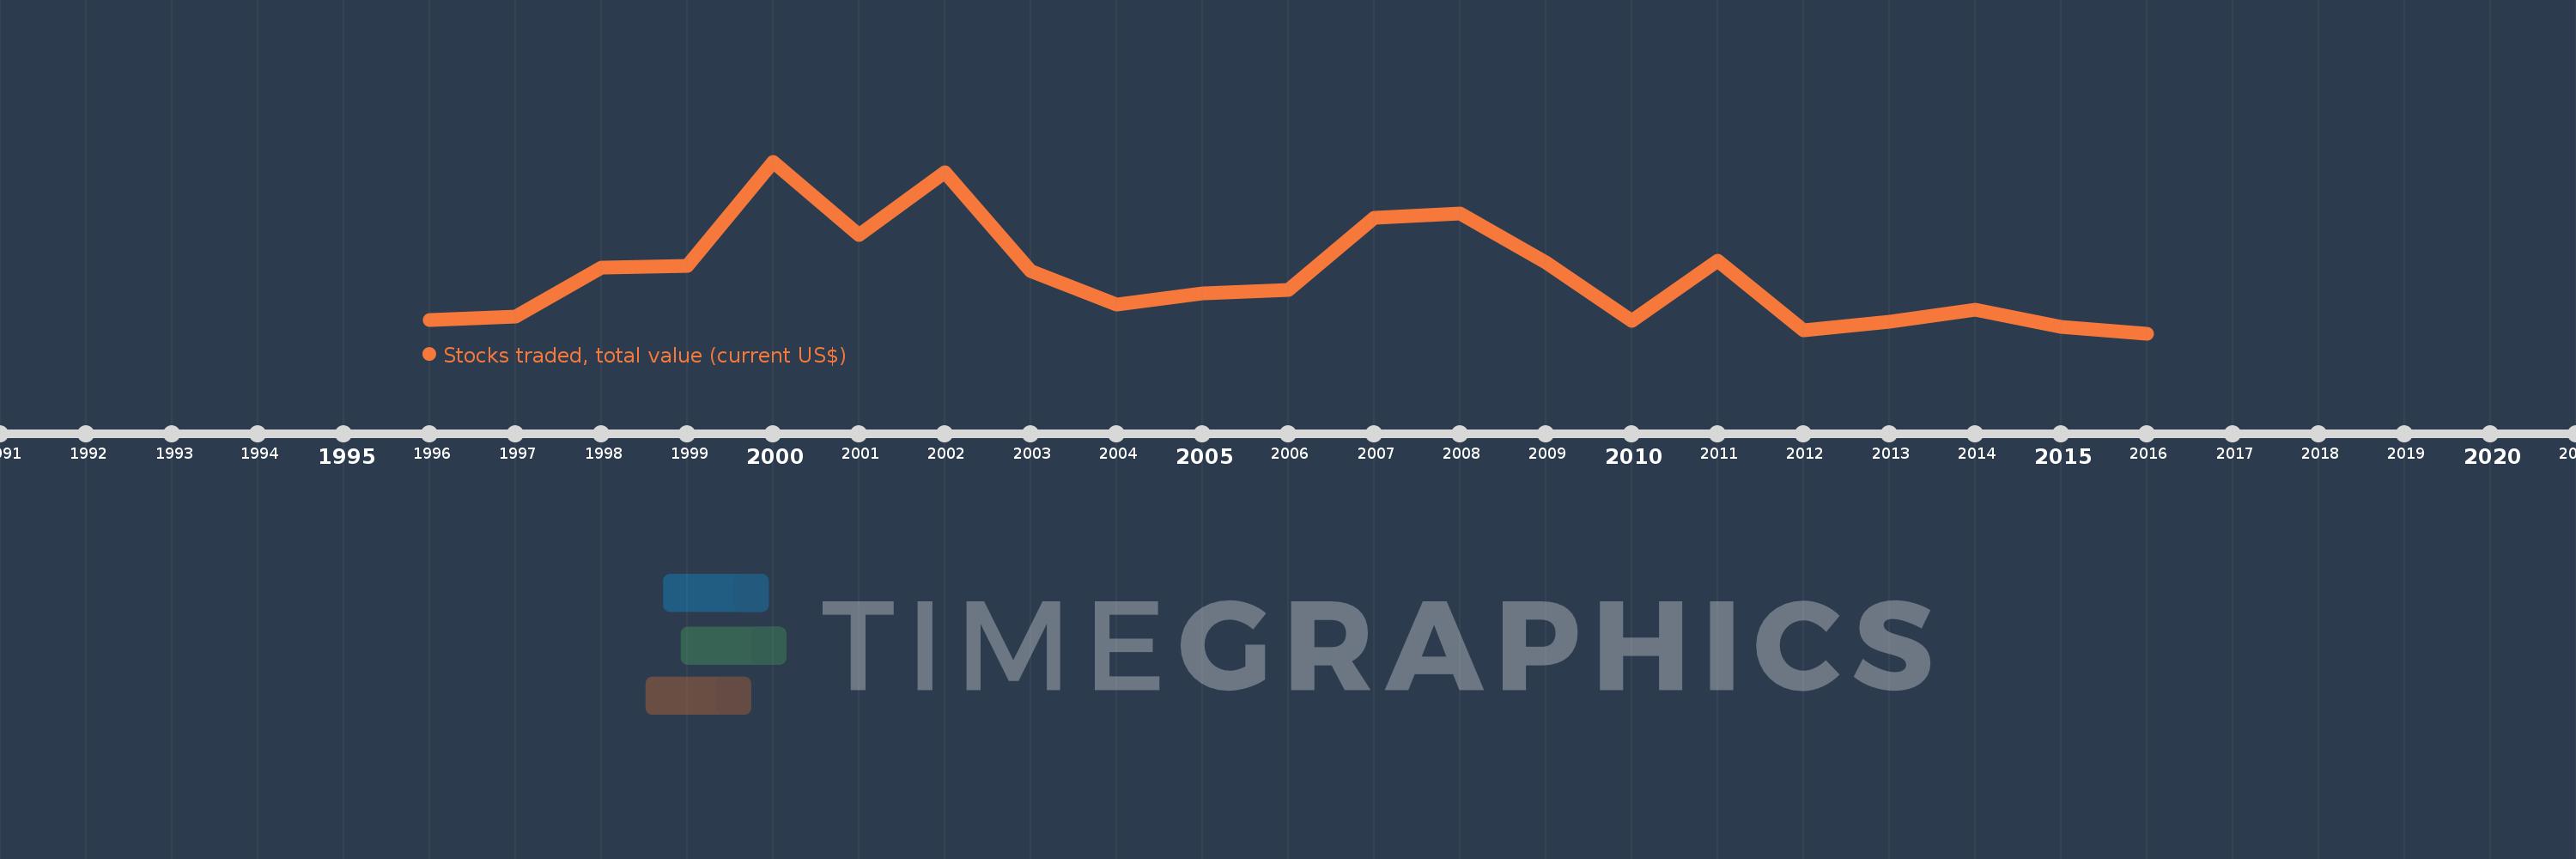
Cette échelle de temps montre un graphique de 1996 année à 2016 année Bermuda. Les données jusqu'à 1995 année ne sont pas présentés. Quantité d'observations actuelles selon dates: 21.

Source (désignation):

Les indicateurs du développement mondiale

Source (organisation):

World Federation of Exchanges database.

Catégories:

Financial Sector

Dernière mise à jour

23 avr. 2017

Les indicateurs de changement de valeurs selon les années

En moyenne:
85.682 mln.
Minimum:
15.31 mln.
1 janv. 2016
Maximum:
226.0 mln.
1 janv. 2000
Pour la date d''observation
Valeur
Changement absolu
Le changement par rapport à la valeur précédente
1 janv. 1996
32.1 mln.
+32.1 mln.
0.0%
1 janv. 1997
35.7 mln.
+3.6 mln.
11.21%
1 janv. 1998
96.4 mln.
+60.7 mln.
170.03%
1 janv. 1999
97.6 mln.
+1.2 mln.
1.24%
1 janv. 2000
226.0 mln.
+128.4 mln.
131.56%
1 janv. 2001
136.0 mln.
-90.0 mln.
-39.82%
1 janv. 2002
213.0 mln.
+77.0 mln.
56.62%
1 janv. 2003
92.0 mln.
-121.0 mln.
-56.81%
1 janv. 2004
50.72 mln.
-41.28 mln.
-44.87%
1 janv. 2005
63.97 mln.
+13.25 mln.
26.12%
1 janv. 2006
68.35 mln.
+4.38 mln.
6.85%
1 janv. 2007
157.0 mln.
+88.65 mln.
129.7%
1 janv. 2008
161.92 mln.
+4.92 mln.
3.13%
1 janv. 2009
102.0 mln.
-59.92 mln.
-37.01%
1 janv. 2010
30.99 mln.
-71.01 mln.
-69.62%
1 janv. 2011
104.51 mln.
+73.52 mln.
237.24%
1 janv. 2012
18.73 mln.
-85.78 mln.
-82.08%
1 janv. 2013
29.26 mln.
+10.53 mln.
56.22%
1 janv. 2014
44.1 mln.
+14.84 mln.
50.72%
1 janv. 2015
23.67 mln.
-20.43 mln.
-46.33%
1 janv. 2016
15.31 mln.
-8.36 mln.
-35.32%

Classement des pays selon les statistiques actuelles par années