29
/fr/
fr
AIzaSyAYiBZKx7MnpbEhh9jyipgxe19OcubqV5w
April 1, 2024
62722
World
WLD
false
2
1
International tourism, number of departures
2015,2014,2013,2012,2011,2010,2009,2008,2007,2006,2005,2004,2003,2002,2001,2000,1999,1998,1997,1996
Download
Bibliothèque de statistiques globales →World →

International tourism, number of departures

Cette statistique dans les autres pays:
AlbaniaAlgeriaAngolaAntigua and BarbudaArgentinaArmeniaAustraliaAustriaAzerbaijanBangladeshBelarusBelgiumBermudaBoliviaBrazilBritish Virgin IslandsBulgariaBurundiCambodiaCanadaCentral African RepublicCentral Europe and the BalticsChadChileChinaColombiaCongo, Dem. Rep.Congo, Rep.Costa RicaCroatiaCubaCyprusCzech RepublicDenmarkDominican RepublicEarly-demographic dividendEast Asia & PacificEast Asia & Pacific (excluding high income)East Asia & Pacific (IDA & IBRD countries)EcuadorEgypt, Arab Rep.El SalvadorEstoniaEthiopiaEuro areaEurope & Central AsiaEurope & Central Asia (excluding high income)Europe & Central Asia (IDA & IBRD countries)European UnionFijiFinlandFranceFrench PolynesiaGabonGambia, TheGeorgiaGermanyGreeceGuatemalaHigh incomeHondurasHong Kong SAR, ChinaHungaryIBRD onlyIcelandIDA & IBRD totalIndiaIndonesiaIran, Islamic Rep.IrelandIsraelItalyJapanJordanKazakhstanKorea, Rep.KuwaitKyrgyz RepublicLao PDRLate-demographic dividendLatin America & Caribbean Latin America & Caribbean (excluding high income)Latin America & the Caribbean (IDA & IBRD countries)LatviaLibyaLithuaniaLow & middle incomeLower middle incomeLuxembourgMacao SAR, ChinaMadagascarMalaysiaMaldivesMaltaMauritiusMexicoMiddle incomeMoldovaMoroccoNepalNetherlandsNew CaledoniaNew ZealandNicaraguaNigerNorth AmericaNorwayOECD membersOmanPalauPanamaPapua New GuineaParaguayPeruPhilippinesPolandPortugalPost-demographic dividendPuerto RicoRomaniaRussian FederationSamoaSaudi ArabiaSeychellesSierra LeoneSingaporeSlovak RepublicSloveniaSouth AfricaSouth AsiaSouth Asia (IDA & IBRD)SpainSri LankaSudanSwazilandSwedenSwitzerlandSyrian Arab RepublicTajikistanTanzaniaThailandTrinidad and TobagoTunisiaTurkeyTurkmenistanTuvaluUgandaUkraineUnited KingdomUnited StatesUpper middle incomeUruguayUzbekistanVanuatuVenezuela, RBWorldZimbabwe
La ligne de temps
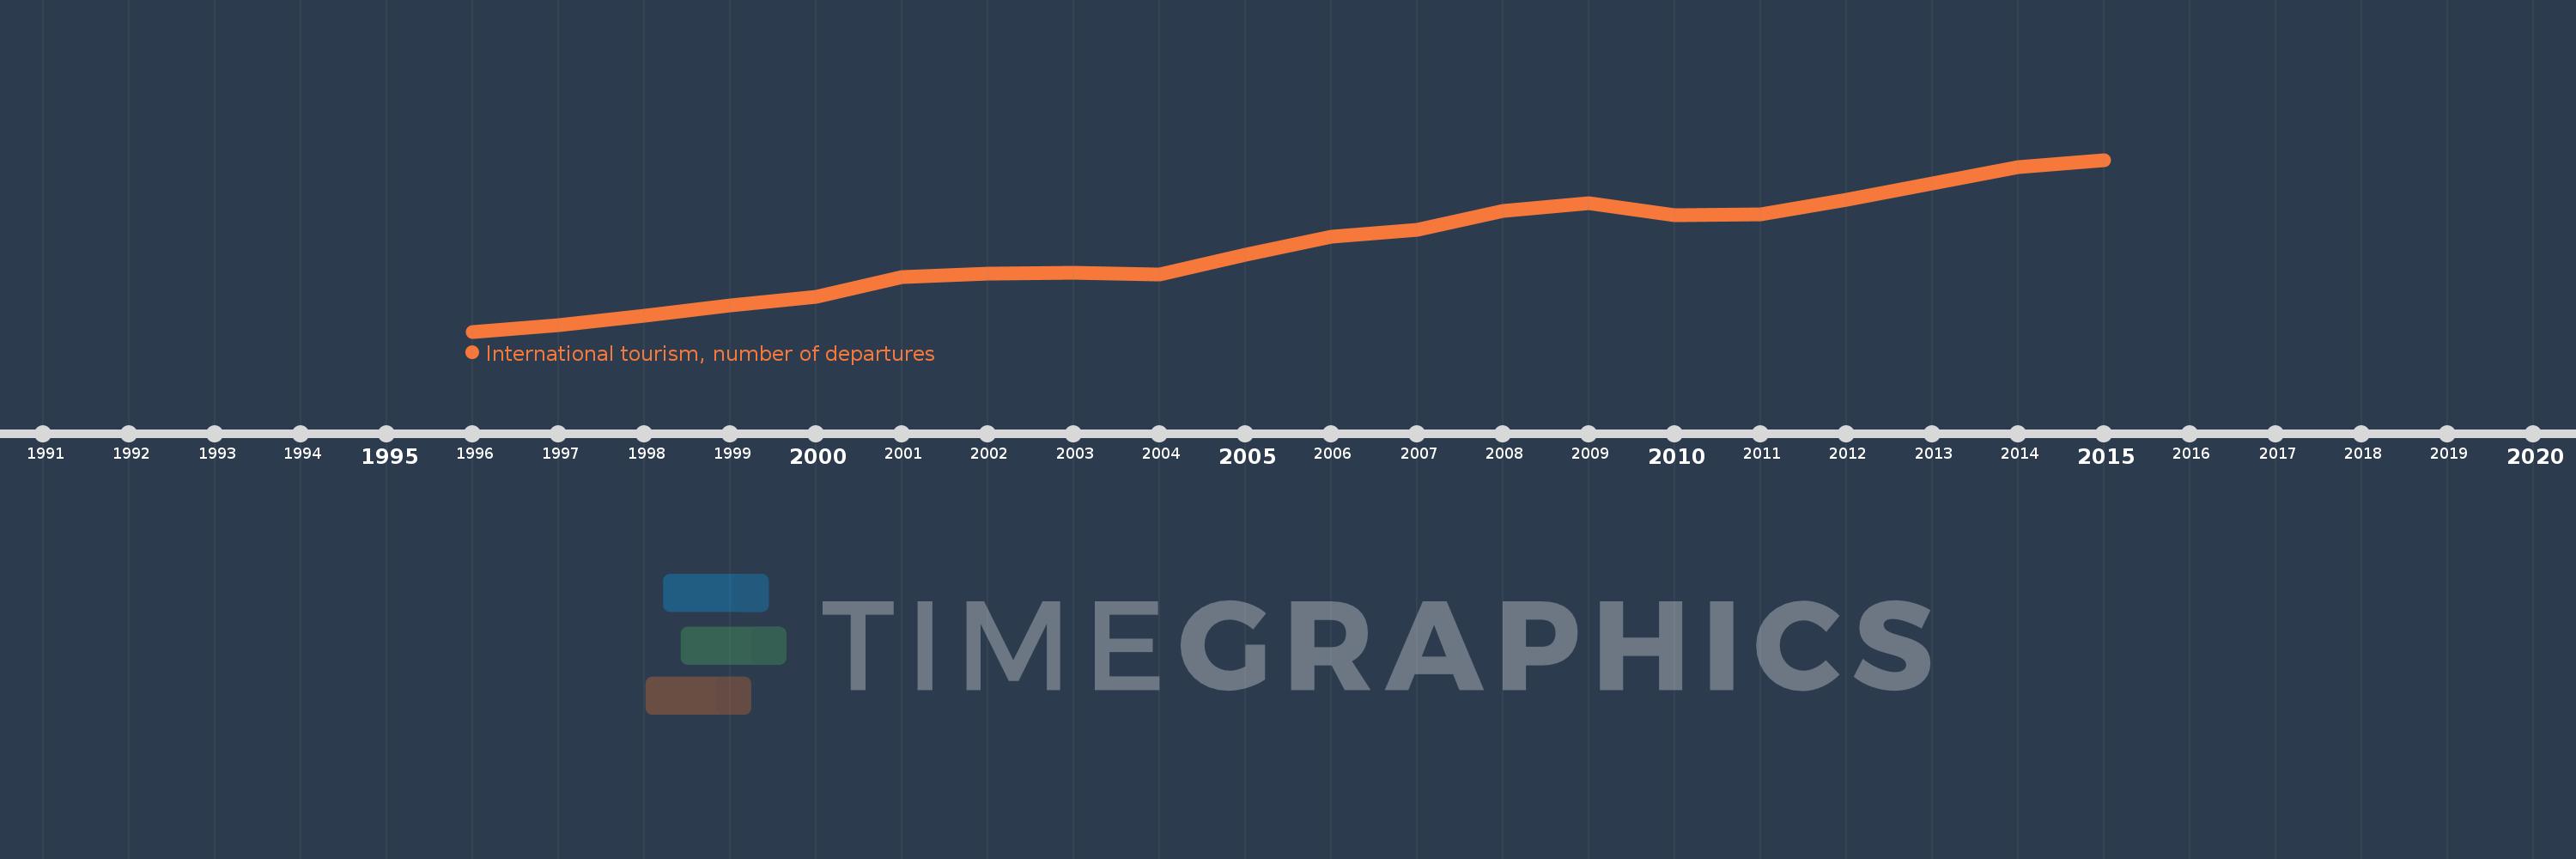
Cette échelle de temps montre un graphique de 1996 année à 2015 année World. Les données jusqu'à 1995 année ne sont pas présentés. Quantité d'observations actuelles selon dates: 20.
Source (désignation):
Les indicateurs du développement mondiale
Source (organisation):
World Tourism Organization, Yearbook of Tourism Statistics, Compendium of Tourism Statistics and data files.
Catégories:
Private Sector, Trade
Dernière mise à jour
23 avr. 2017
Les indicateurs de changement de valeurs selon les années
En moyenne:
915.608 mln.
Minimum:
623.166 mln.
1 janv. 1996
Maximum:
1.22 mds
1 janv. 2015
Pour la date d''observation
Valeur
Changement absolu
Le changement par rapport à la valeur précédente
1 janv. 1996
623.166 mln.
+623.166 mln.
0.0%
1 janv. 1997
646.223 mln.
+23.057 mln.
3.7%
1 janv. 1998
679.095 mln.
+32.873 mln.
5.09%
1 janv. 1999
714.598 mln.
+35.502 mln.
5.23%
1 janv. 2000
743.646 mln.
+29.048 mln.
4.06%
1 janv. 2001
811.968 mln.
+68.322 mln.
9.19%
1 janv. 2002
823.225 mln.
+11.257 mln.
1.39%
1 janv. 2003
826.327 mln.
+3.102 mln.
0.38%
1 janv. 2004
820.706 mln.
-5.621 mln.
-0.68%
1 janv. 2005
889.444 mln.
+68.738 mln.
8.38%
1 janv. 2006
952.857 mln.
+63.414 mln.
7.13%
1 janv. 2007
975.411 mln.
+22.554 mln.
2.37%
1 janv. 2008
1.043 mds
+67.39 mln.
6.91%
1 janv. 2009
1.068 mds
+25.456 mln.
2.44%
1 janv. 2010
1.029 mds
-39.315 mln.
-3.68%
1 janv. 2011
1.032 mds
+3.091 mln.
0.3%
1 janv. 2012
1.081 mds
+48.77 mln.
4.73%
1 janv. 2013
1.139 mds
+58.156 mln.
5.38%
1 janv. 2014
1.194 mds
+54.579 mln.
4.79%
1 janv. 2015
1.22 mds
+26.621 mln.
2.23%
Classement des pays selon les statistiques actuelles par années

Commentaires:

Envoyer
PremiumAbout & FeedbackUn accordConfidentialité
logo
© 2022 Selected Technologies LLC – Morgan Hill, California