29
/fr/
fr
AIzaSyAYiBZKx7MnpbEhh9jyipgxe19OcubqV5w
April 1, 2024
37475
IDA & IBRD total
IBT
false
2
1
International tourism, number of departures
2015,2014,2013,2012,2011,2010,2009,2008,2007,2006,2005,2004,2003,2002,2001,2000,1999,1998,1997,1996
Download
Bibliothèque de statistiques globales →IDA & IBRD total →

International tourism, number of departures

Cette statistique dans les autres pays:
AlbaniaAlgeriaAngolaAntigua and BarbudaArgentinaArmeniaAustraliaAustriaAzerbaijanBangladeshBelarusBelgiumBermudaBoliviaBrazilBritish Virgin IslandsBulgariaBurundiCambodiaCanadaCentral African RepublicCentral Europe and the BalticsChadChileChinaColombiaCongo, Dem. Rep.Congo, Rep.Costa RicaCroatiaCubaCyprusCzech RepublicDenmarkDominican RepublicEarly-demographic dividendEast Asia & PacificEast Asia & Pacific (excluding high income)East Asia & Pacific (IDA & IBRD countries)EcuadorEgypt, Arab Rep.El SalvadorEstoniaEthiopiaEuro areaEurope & Central AsiaEurope & Central Asia (excluding high income)Europe & Central Asia (IDA & IBRD countries)European UnionFijiFinlandFranceFrench PolynesiaGabonGambia, TheGeorgiaGermanyGreeceGuatemalaHigh incomeHondurasHong Kong SAR, ChinaHungaryIBRD onlyIcelandIDA & IBRD totalIndiaIndonesiaIran, Islamic Rep.IrelandIsraelItalyJapanJordanKazakhstanKorea, Rep.KuwaitKyrgyz RepublicLao PDRLate-demographic dividendLatin America & Caribbean Latin America & Caribbean (excluding high income)Latin America & the Caribbean (IDA & IBRD countries)LatviaLibyaLithuaniaLow & middle incomeLower middle incomeLuxembourgMacao SAR, ChinaMadagascarMalaysiaMaldivesMaltaMauritiusMexicoMiddle incomeMoldovaMoroccoNepalNetherlandsNew CaledoniaNew ZealandNicaraguaNigerNorth AmericaNorwayOECD membersOmanPalauPanamaPapua New GuineaParaguayPeruPhilippinesPolandPortugalPost-demographic dividendPuerto RicoRomaniaRussian FederationSamoaSaudi ArabiaSeychellesSierra LeoneSingaporeSlovak RepublicSloveniaSouth AfricaSouth AsiaSouth Asia (IDA & IBRD)SpainSri LankaSudanSwazilandSwedenSwitzerlandSyrian Arab RepublicTajikistanTanzaniaThailandTrinidad and TobagoTunisiaTurkeyTurkmenistanTuvaluUgandaUkraineUnited KingdomUnited StatesUpper middle incomeUruguayUzbekistanVanuatuVenezuela, RBWorldZimbabwe
La ligne de temps
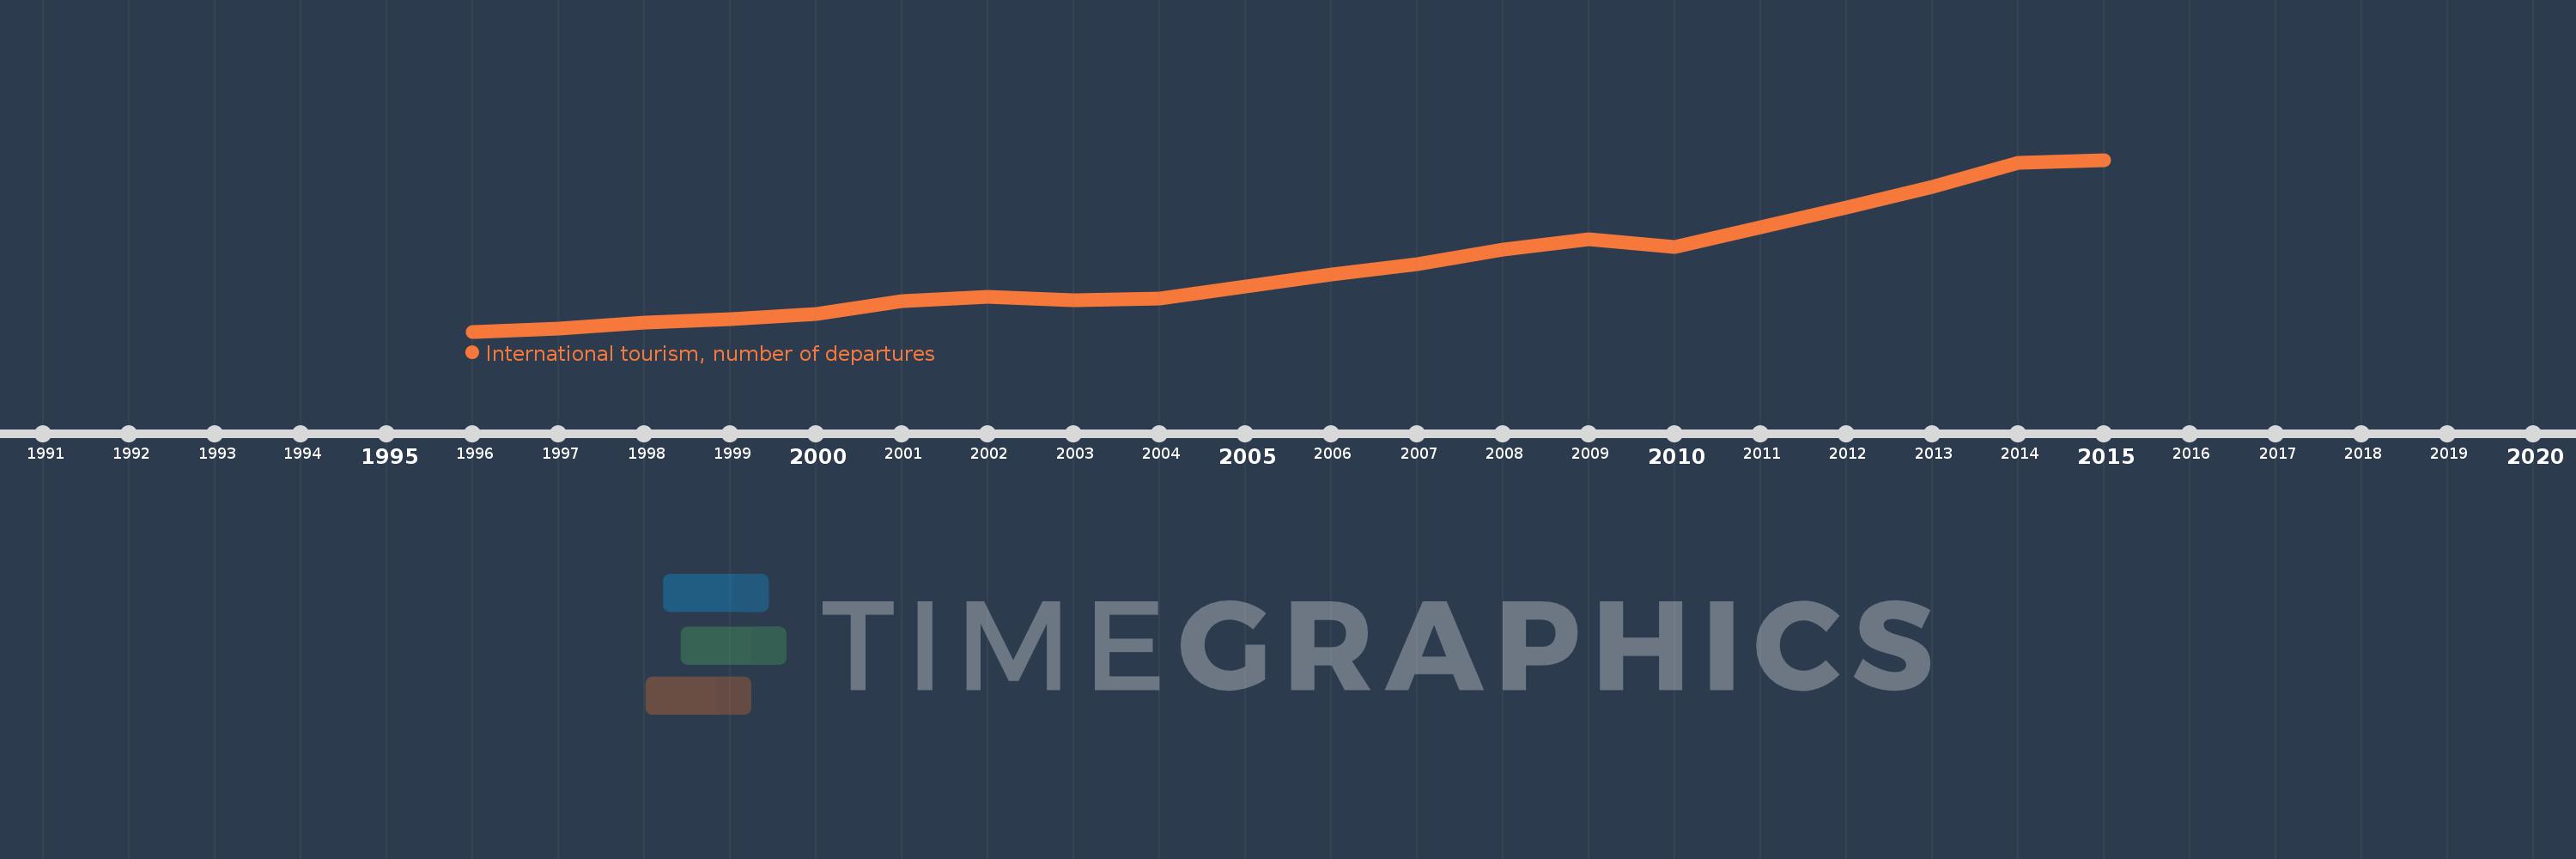
Cette échelle de temps montre un graphique de 1996 année à 2015 année IDA & IBRD total. Les données jusqu'à 1995 année ne sont pas présentés. Quantité d'observations actuelles selon dates: 20.
Source (désignation):
Les indicateurs du développement mondiale
Source (organisation):
World Tourism Organization, Yearbook of Tourism Statistics, Compendium of Tourism Statistics and data files.
Catégories:
Private Sector, Trade
Dernière mise à jour
23 avr. 2017
Les indicateurs de changement de valeurs selon les années
En moyenne:
310.947 mln.
Minimum:
168.859 mln.
1 janv. 1996
Maximum:
540.102 mln.
1 janv. 2015
Pour la date d''observation
Valeur
Changement absolu
Le changement par rapport à la valeur précédente
1 janv. 1996
168.859 mln.
+168.859 mln.
0.0%
1 janv. 1997
174.949 mln.
+6.09 mln.
3.61%
1 janv. 1998
189.22 mln.
+14.271 mln.
8.16%
1 janv. 1999
195.04 mln.
+5.82 mln.
3.08%
1 janv. 2000
206.805 mln.
+11.765 mln.
6.03%
1 janv. 2001
235.414 mln.
+28.609 mln.
13.83%
1 janv. 2002
243.698 mln.
+8.284 mln.
3.52%
1 janv. 2003
235.951 mln.
-7.747 mln.
-3.18%
1 janv. 2004
240.964 mln.
+5.013 mln.
2.12%
1 janv. 2005
267.226 mln.
+26.263 mln.
10.9%
1 janv. 2006
292.225 mln.
+24.999 mln.
9.35%
1 janv. 2007
314.594 mln.
+22.369 mln.
7.65%
1 janv. 2008
346.761 mln.
+32.167 mln.
10.22%
1 janv. 2009
368.203 mln.
+21.442 mln.
6.18%
1 janv. 2010
351.849 mln.
-16.354 mln.
-4.44%
1 janv. 2011
394.083 mln.
+42.234 mln.
12.0%
1 janv. 2012
437.077 mln.
+42.994 mln.
10.91%
1 janv. 2013
482.028 mln.
+44.951 mln.
10.28%
1 janv. 2014
533.895 mln.
+51.867 mln.
10.76%
1 janv. 2015
540.102 mln.
+6.207 mln.
1.16%
Classement des pays selon les statistiques actuelles par années

Commentaires:

Envoyer
PremiumAbout & FeedbackUn accordConfidentialité
logo
© 2022 Selected Technologies LLC – Morgan Hill, California