29
/fr/
fr
AIzaSyAYiBZKx7MnpbEhh9jyipgxe19OcubqV5w
April 1, 2024
52729
OECD members
OED
false
2
1
International tourism, number of departures
2015,2014,2013,2012,2011,2010,2009,2008,2007,2006,2005,2004,2003,2002,2001,2000,1999,1998,1997,1996
Download
Bibliothèque de statistiques globales →OECD members →

International tourism, number of departures

Cette statistique dans les autres pays:
AlbaniaAlgeriaAngolaAntigua and BarbudaArgentinaArmeniaAustraliaAustriaAzerbaijanBangladeshBelarusBelgiumBermudaBoliviaBrazilBritish Virgin IslandsBulgariaBurundiCambodiaCanadaCentral African RepublicCentral Europe and the BalticsChadChileChinaColombiaCongo, Dem. Rep.Congo, Rep.Costa RicaCroatiaCubaCyprusCzech RepublicDenmarkDominican RepublicEarly-demographic dividendEast Asia & PacificEast Asia & Pacific (excluding high income)East Asia & Pacific (IDA & IBRD countries)EcuadorEgypt, Arab Rep.El SalvadorEstoniaEthiopiaEuro areaEurope & Central AsiaEurope & Central Asia (excluding high income)Europe & Central Asia (IDA & IBRD countries)European UnionFijiFinlandFranceFrench PolynesiaGabonGambia, TheGeorgiaGermanyGreeceGuatemalaHigh incomeHondurasHong Kong SAR, ChinaHungaryIBRD onlyIcelandIDA & IBRD totalIndiaIndonesiaIran, Islamic Rep.IrelandIsraelItalyJapanJordanKazakhstanKorea, Rep.KuwaitKyrgyz RepublicLao PDRLate-demographic dividendLatin America & Caribbean Latin America & Caribbean (excluding high income)Latin America & the Caribbean (IDA & IBRD countries)LatviaLibyaLithuaniaLow & middle incomeLower middle incomeLuxembourgMacao SAR, ChinaMadagascarMalaysiaMaldivesMaltaMauritiusMexicoMiddle incomeMoldovaMoroccoNepalNetherlandsNew CaledoniaNew ZealandNicaraguaNigerNorth AmericaNorwayOECD membersOmanPalauPanamaPapua New GuineaParaguayPeruPhilippinesPolandPortugalPost-demographic dividendPuerto RicoRomaniaRussian FederationSamoaSaudi ArabiaSeychellesSierra LeoneSingaporeSlovak RepublicSloveniaSouth AfricaSouth AsiaSouth Asia (IDA & IBRD)SpainSri LankaSudanSwazilandSwedenSwitzerlandSyrian Arab RepublicTajikistanTanzaniaThailandTrinidad and TobagoTunisiaTurkeyTurkmenistanTuvaluUgandaUkraineUnited KingdomUnited StatesUpper middle incomeUruguayUzbekistanVanuatuVenezuela, RBWorldZimbabwe
La ligne de temps
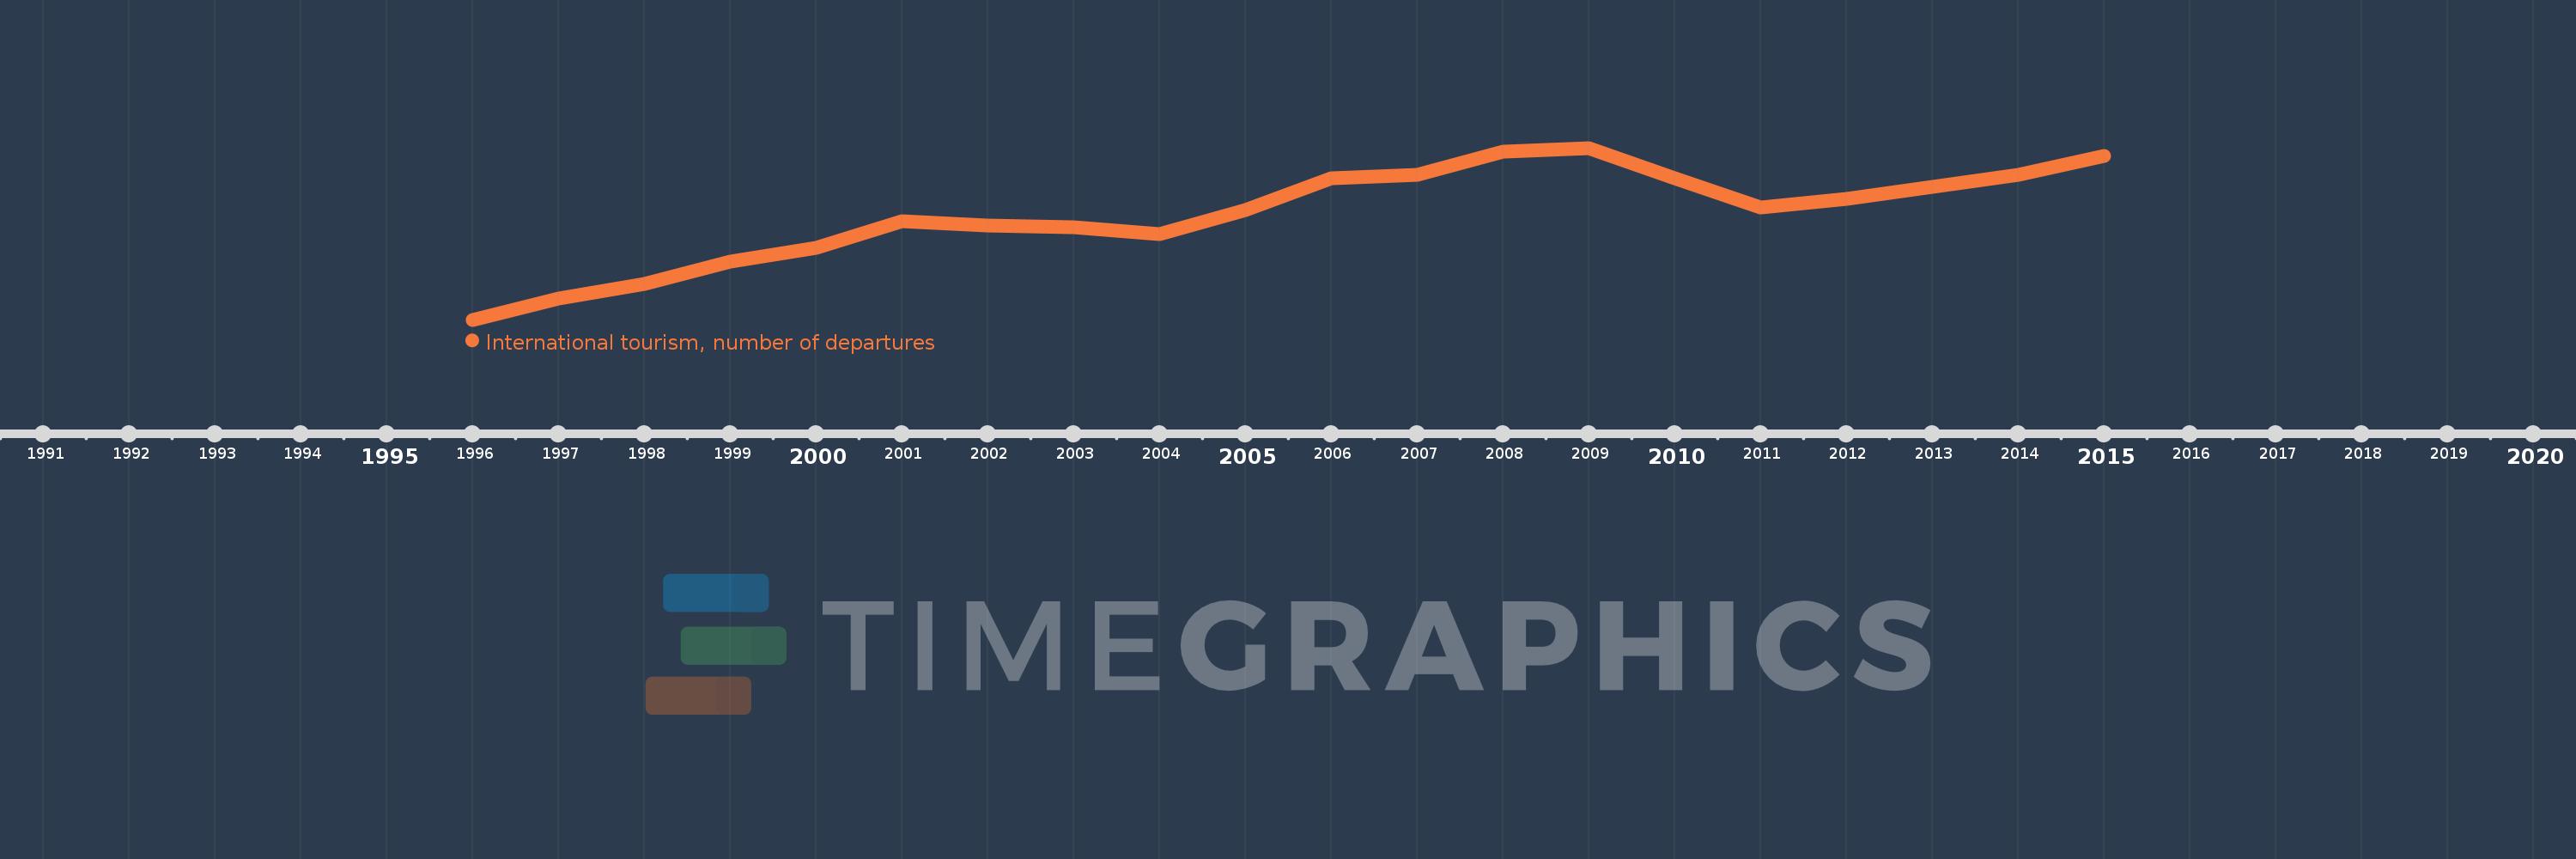
Cette échelle de temps montre un graphique de 1996 année à 2015 année OECD members. Les données jusqu'à 1995 année ne sont pas présentés. Quantité d'observations actuelles selon dates: 20.
Source (désignation):
Les indicateurs du développement mondiale
Source (organisation):
World Tourism Organization, Yearbook of Tourism Statistics, Compendium of Tourism Statistics and data files.
Catégories:
Private Sector, Trade
Dernière mise à jour
23 avr. 2017
Les indicateurs de changement de valeurs selon les années
En moyenne:
472.98 mln.
Minimum:
364.959 mln.
1 janv. 1996
Maximum:
540.767 mln.
1 janv. 2009
Pour la date d''observation
Valeur
Changement absolu
Le changement par rapport à la valeur précédente
1 janv. 1996
364.959 mln.
+364.959 mln.
0.0%
1 janv. 1997
386.604 mln.
+21.645 mln.
5.93%
1 janv. 1998
401.541 mln.
+14.937 mln.
3.86%
1 janv. 1999
424.888 mln.
+23.348 mln.
5.81%
1 janv. 2000
438.697 mln.
+13.809 mln.
3.25%
1 janv. 2001
465.349 mln.
+26.651 mln.
6.08%
1 janv. 2002
461.706 mln.
-3.642 mln.
-0.78%
1 janv. 2003
459.383 mln.
-2.324 mln.
-0.5%
1 janv. 2004
452.853 mln.
-6.529 mln.
-1.42%
1 janv. 2005
477.473 mln.
+24.62 mln.
5.44%
1 janv. 2006
510.118 mln.
+32.644 mln.
6.84%
1 janv. 2007
513.43 mln.
+3.312 mln.
0.65%
1 janv. 2008
536.582 mln.
+23.152 mln.
4.51%
1 janv. 2009
540.767 mln.
+4.186 mln.
0.78%
1 janv. 2010
510.093 mln.
-30.675 mln.
-5.67%
1 janv. 2011
480.071 mln.
-30.022 mln.
-5.89%
1 janv. 2012
488.502 mln.
+8.431 mln.
1.76%
1 janv. 2013
501.038 mln.
+12.535 mln.
2.57%
1 janv. 2014
512.89 mln.
+11.853 mln.
2.37%
1 janv. 2015
532.646 mln.
+19.756 mln.
3.85%
Classement des pays selon les statistiques actuelles par années

Commentaires:

Envoyer
PremiumAbout & FeedbackUn accordConfidentialité
logo
© 2022 Selected Technologies LLC – Morgan Hill, California