33
/fr/
AIzaSyAYiBZKx7MnpbEhh9jyipgxe19OcubqV5w
August 1, 2025
30803
Europe & Central Asia
ECS
false
2
1
International tourism, number of departures
2015,2014,2013,2012,2011,2010,2009,2008,2007,2006,2005,2004,2003,2002,2001,2000,1999,1998,1997,1996
Download
Bibliothèque de statistiques globales →Europe & Central Asia →

International tourism, number of departures

Cette statistique dans les autres pays:

AlbaniaAlgeriaAngolaAntigua and BarbudaArgentinaArmeniaAustraliaAustriaAzerbaijanBangladeshBelarusBelgiumBermudaBoliviaBrazilBritish Virgin IslandsBulgariaBurundiCambodiaCanadaCentral African RepublicCentral Europe and the BalticsChadChileChinaColombiaCongo, Dem. Rep.Congo, Rep.Costa RicaCroatiaCubaCyprusCzech RepublicDenmarkDominican RepublicEarly-demographic dividendEast Asia & PacificEast Asia & Pacific (excluding high income)East Asia & Pacific (IDA & IBRD countries)EcuadorEgypt, Arab Rep.El SalvadorEstoniaEthiopiaEuro areaEurope & Central AsiaEurope & Central Asia (excluding high income)Europe & Central Asia (IDA & IBRD countries)European UnionFijiFinlandFranceFrench PolynesiaGabonGambia, TheGeorgiaGermanyGreeceGuatemalaHigh incomeHondurasHong Kong SAR, ChinaHungaryIBRD onlyIcelandIDA & IBRD totalIndiaIndonesiaIran, Islamic Rep.IrelandIsraelItalyJapanJordanKazakhstanKorea, Rep.KuwaitKyrgyz RepublicLao PDRLate-demographic dividendLatin America & Caribbean Latin America & Caribbean (excluding high income)Latin America & the Caribbean (IDA & IBRD countries)LatviaLibyaLithuaniaLow & middle incomeLower middle incomeLuxembourgMacao SAR, ChinaMadagascarMalaysiaMaldivesMaltaMauritiusMexicoMiddle incomeMoldovaMoroccoNepalNetherlandsNew CaledoniaNew ZealandNicaraguaNigerNorth AmericaNorwayOECD membersOmanPalauPanamaPapua New GuineaParaguayPeruPhilippinesPolandPortugalPost-demographic dividendPuerto RicoRomaniaRussian FederationSamoaSaudi ArabiaSeychellesSierra LeoneSingaporeSlovak RepublicSloveniaSouth AfricaSouth AsiaSouth Asia (IDA & IBRD)SpainSri LankaSudanSwazilandSwedenSwitzerlandSyrian Arab RepublicTajikistanTanzaniaThailandTrinidad and TobagoTunisiaTurkeyTurkmenistanTuvaluUgandaUkraineUnited KingdomUnited StatesUpper middle incomeUruguayUzbekistanVanuatuVenezuela, RBWorldZimbabwe

La ligne de temps

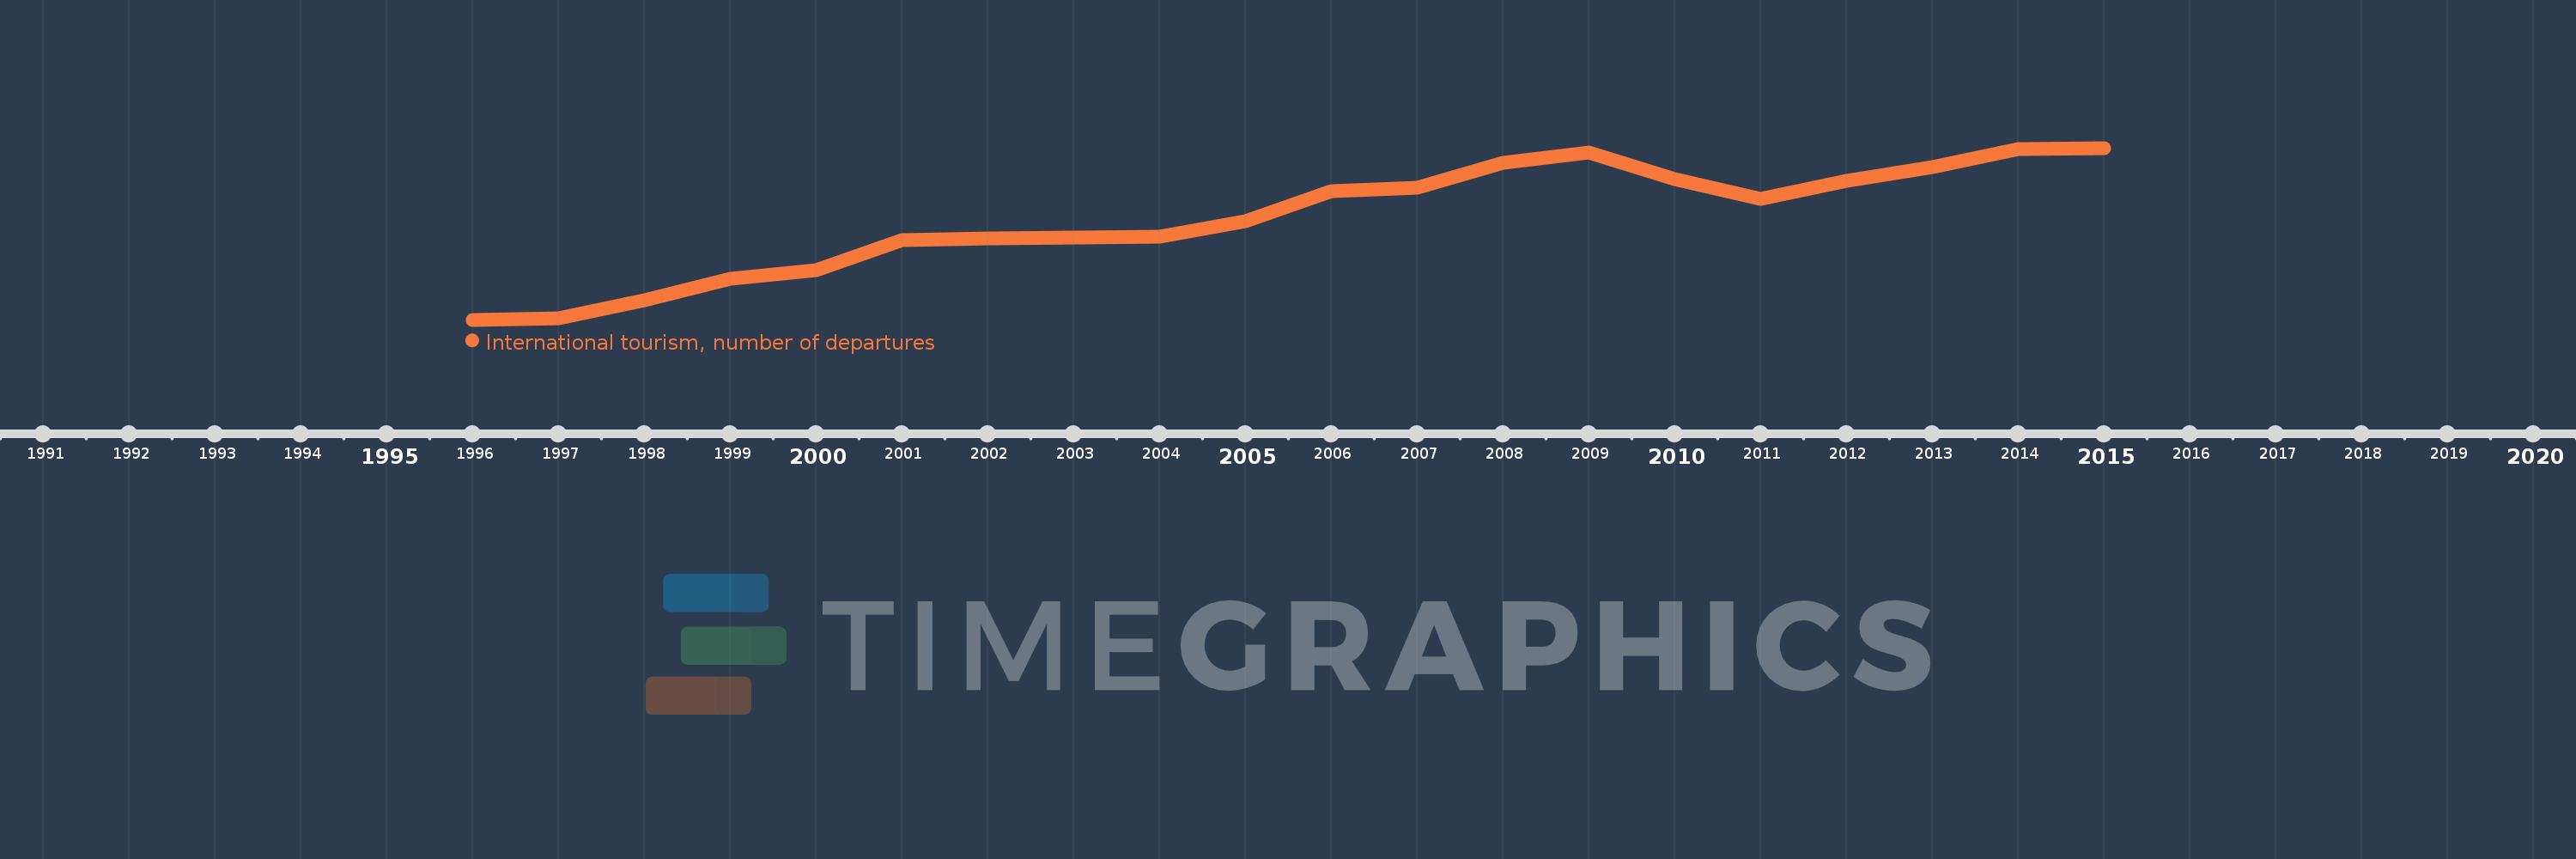
Cette échelle de temps montre un graphique de 1996 année à 2015 année Europe & Central Asia. Les données jusqu'à 1995 année ne sont pas présentés. Quantité d'observations actuelles selon dates: 20.

Source (désignation):

Les indicateurs du développement mondiale

Source (organisation):

World Tourism Organization, Yearbook of Tourism Statistics, Compendium of Tourism Statistics and data files.

Catégories:

Private Sector, Trade

Dernière mise à jour

23 avr. 2017

Les indicateurs de changement de valeurs selon les années

En moyenne:
428.958 mln.
Minimum:
317.362 mln.
1 janv. 1996
Maximum:
507.622 mln.
1 janv. 2015
Pour la date d''observation
Valeur
Changement absolu
Le changement par rapport à la valeur précédente
1 janv. 1996
317.362 mln.
+317.362 mln.
0.0%
1 janv. 1997
318.515 mln.
+1.153 mln.
0.36%
1 janv. 1998
339.011 mln.
+20.496 mln.
6.44%
1 janv. 1999
362.581 mln.
+23.57 mln.
6.95%
1 janv. 2000
372.5 mln.
+9.919 mln.
2.74%
1 janv. 2001
405.204 mln.
+32.704 mln.
8.78%
1 janv. 2002
406.996 mln.
+1.791 mln.
0.44%
1 janv. 2003
408.676 mln.
+1.68 mln.
0.41%
1 janv. 2004
409.737 mln.
+1.062 mln.
0.26%
1 janv. 2005
426.207 mln.
+16.47 mln.
4.02%
1 janv. 2006
459.405 mln.
+33.198 mln.
7.79%
1 janv. 2007
463.622 mln.
+4.217 mln.
0.92%
1 janv. 2008
490.87 mln.
+27.248 mln.
5.88%
1 janv. 2009
502.973 mln.
+12.103 mln.
2.47%
1 janv. 2010
473.011 mln.
-29.962 mln.
-5.96%
1 janv. 2011
451.161 mln.
-21.849 mln.
-4.62%
1 janv. 2012
470.755 mln.
+19.593 mln.
4.34%
1 janv. 2013
486.258 mln.
+15.503 mln.
3.29%
1 janv. 2014
506.7 mln.
+20.442 mln.
4.2%
1 janv. 2015
507.622 mln.
+921.604 milles
0.18%

Classement des pays selon les statistiques actuelles par années