33
/fr/
AIzaSyAYiBZKx7MnpbEhh9jyipgxe19OcubqV5w
August 1, 2025
51047
Middle income
MIC
false
2
1
International tourism, number of departures
2015,2014,2013,2012,2011,2010,2009,2008,2007,2006,2005,2004,2003,2002,2001,2000,1999,1998,1997,1996
Download
Bibliothèque de statistiques globales →Middle income →

International tourism, number of departures

Cette statistique dans les autres pays:

AlbaniaAlgeriaAngolaAntigua and BarbudaArgentinaArmeniaAustraliaAustriaAzerbaijanBangladeshBelarusBelgiumBermudaBoliviaBrazilBritish Virgin IslandsBulgariaBurundiCambodiaCanadaCentral African RepublicCentral Europe and the BalticsChadChileChinaColombiaCongo, Dem. Rep.Congo, Rep.Costa RicaCroatiaCubaCyprusCzech RepublicDenmarkDominican RepublicEarly-demographic dividendEast Asia & PacificEast Asia & Pacific (excluding high income)East Asia & Pacific (IDA & IBRD countries)EcuadorEgypt, Arab Rep.El SalvadorEstoniaEthiopiaEuro areaEurope & Central AsiaEurope & Central Asia (excluding high income)Europe & Central Asia (IDA & IBRD countries)European UnionFijiFinlandFranceFrench PolynesiaGabonGambia, TheGeorgiaGermanyGreeceGuatemalaHigh incomeHondurasHong Kong SAR, ChinaHungaryIBRD onlyIcelandIDA & IBRD totalIndiaIndonesiaIran, Islamic Rep.IrelandIsraelItalyJapanJordanKazakhstanKorea, Rep.KuwaitKyrgyz RepublicLao PDRLate-demographic dividendLatin America & Caribbean Latin America & Caribbean (excluding high income)Latin America & the Caribbean (IDA & IBRD countries)LatviaLibyaLithuaniaLow & middle incomeLower middle incomeLuxembourgMacao SAR, ChinaMadagascarMalaysiaMaldivesMaltaMauritiusMexicoMiddle incomeMoldovaMoroccoNepalNetherlandsNew CaledoniaNew ZealandNicaraguaNigerNorth AmericaNorwayOECD membersOmanPalauPanamaPapua New GuineaParaguayPeruPhilippinesPolandPortugalPost-demographic dividendPuerto RicoRomaniaRussian FederationSamoaSaudi ArabiaSeychellesSierra LeoneSingaporeSlovak RepublicSloveniaSouth AfricaSouth AsiaSouth Asia (IDA & IBRD)SpainSri LankaSudanSwazilandSwedenSwitzerlandSyrian Arab RepublicTajikistanTanzaniaThailandTrinidad and TobagoTunisiaTurkeyTurkmenistanTuvaluUgandaUkraineUnited KingdomUnited StatesUpper middle incomeUruguayUzbekistanVanuatuVenezuela, RBWorldZimbabwe

La ligne de temps

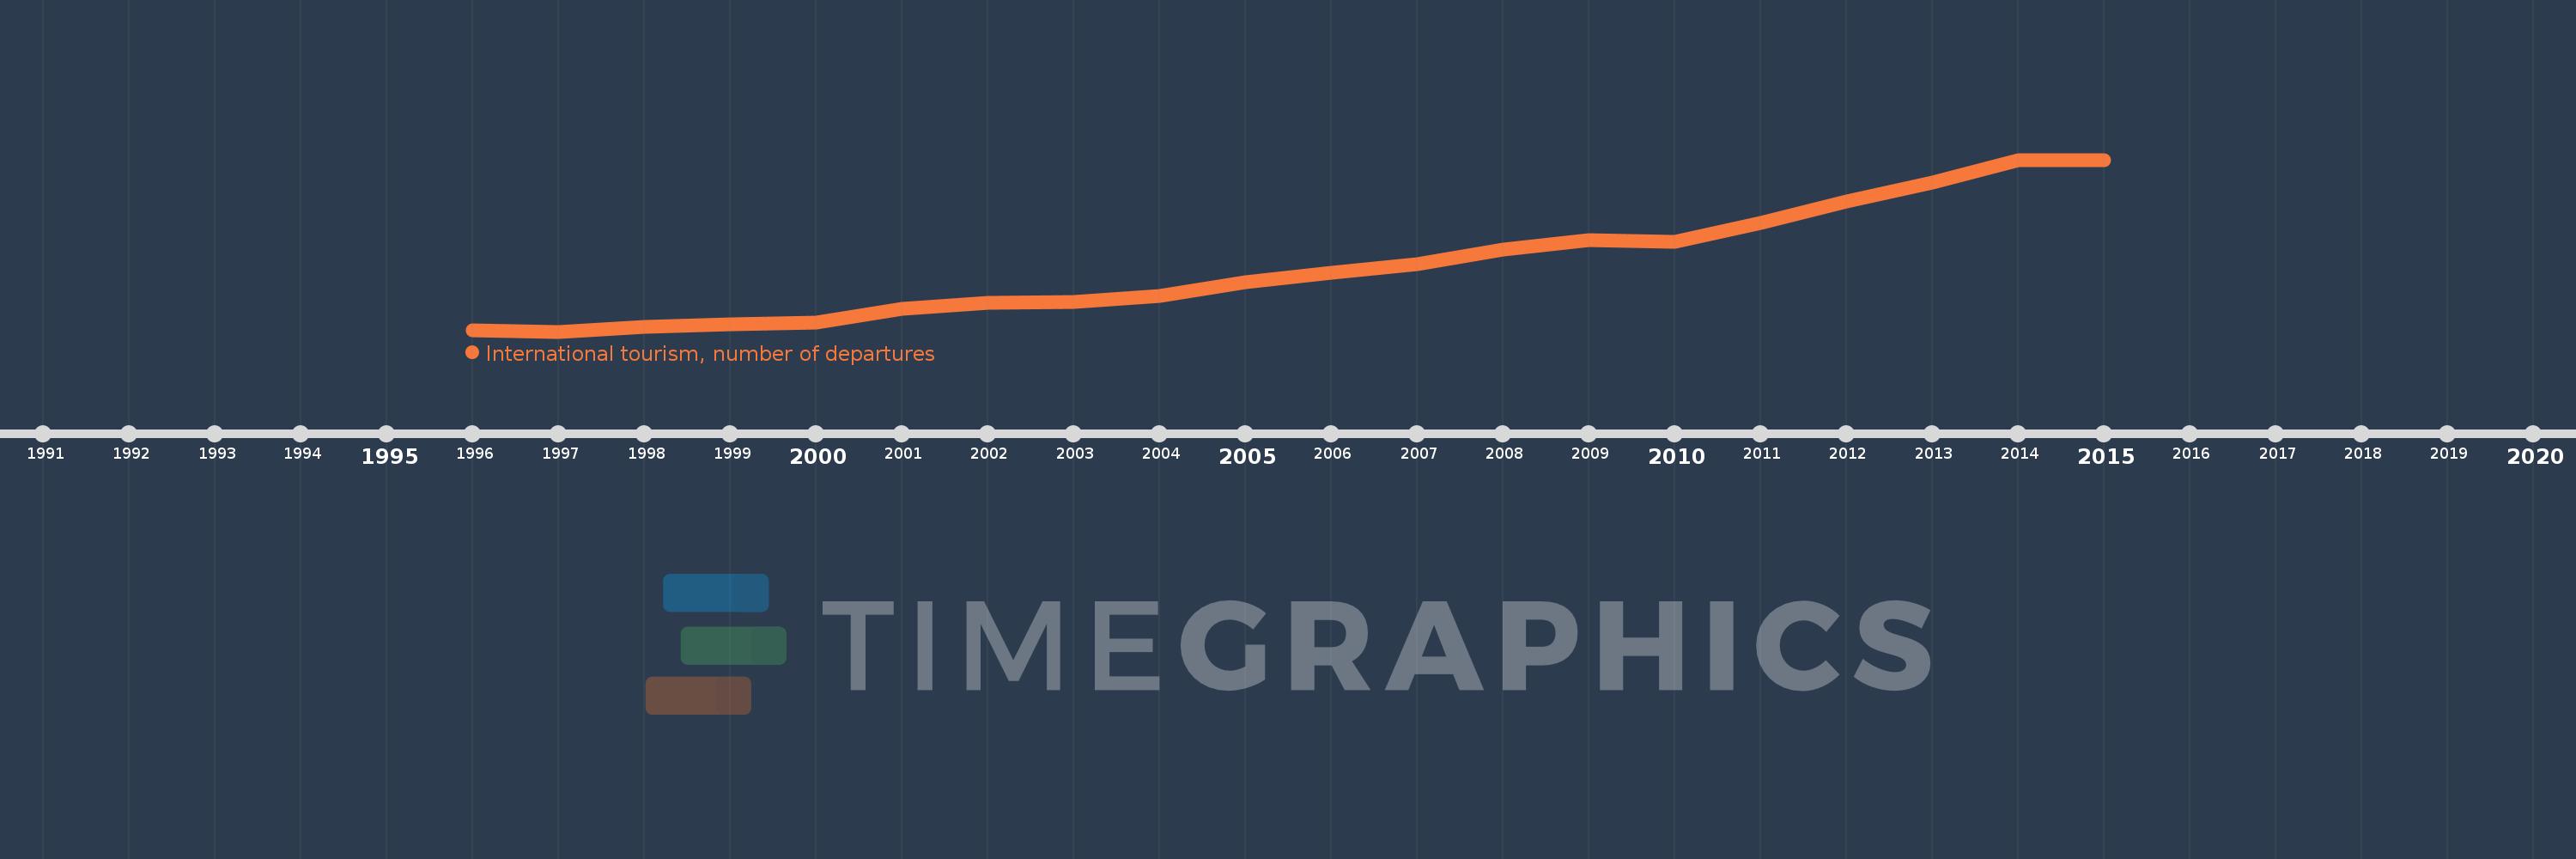
Cette échelle de temps montre un graphique de 1996 année à 2015 année Middle income. Les données jusqu'à 1995 année ne sont pas présentés. Quantité d'observations actuelles selon dates: 20.

Source (désignation):

Les indicateurs du développement mondiale

Source (organisation):

World Tourism Organization, Yearbook of Tourism Statistics, Compendium of Tourism Statistics and data files.

Catégories:

Private Sector, Trade

Dernière mise à jour

23 avr. 2017

Les indicateurs de changement de valeurs selon les années

En moyenne:
227.078 mln.
Minimum:
108.643 mln.
1 janv. 1997
Maximum:
419.549 mln.
1 janv. 2014
Pour la date d''observation
Valeur
Changement absolu
Le changement par rapport à la valeur précédente
1 janv. 1996
111.564 mln.
+111.564 mln.
0.0%
1 janv. 1997
108.643 mln.
-2.921 mln.
-2.62%
1 janv. 1998
117.235 mln.
+8.592 mln.
7.91%
1 janv. 1999
121.396 mln.
+4.161 mln.
3.55%
1 janv. 2000
125.59 mln.
+4.194 mln.
3.45%
1 janv. 2001
149.597 mln.
+24.007 mln.
19.12%
1 janv. 2002
160.693 mln.
+11.097 mln.
7.42%
1 janv. 2003
161.704 mln.
+1.011 mln.
0.63%
1 janv. 2004
172.757 mln.
+11.052 mln.
6.84%
1 janv. 2005
197.428 mln.
+24.671 mln.
14.28%
1 janv. 2006
215.672 mln.
+18.244 mln.
9.24%
1 janv. 2007
231.336 mln.
+15.663 mln.
7.26%
1 janv. 2008
257.318 mln.
+25.982 mln.
11.23%
1 janv. 2009
273.671 mln.
+16.353 mln.
6.36%
1 janv. 2010
271.691 mln.
-1.98 mln.
-0.72%
1 janv. 2011
305.701 mln.
+34.01 mln.
12.52%
1 janv. 2012
343.383 mln.
+37.682 mln.
12.33%
1 janv. 2013
377.704 mln.
+34.321 mln.
10.0%
1 janv. 2014
419.549 mln.
+41.845 mln.
11.08%
1 janv. 2015
418.928 mln.
-621.627 milles
-0.15%

Classement des pays selon les statistiques actuelles par années