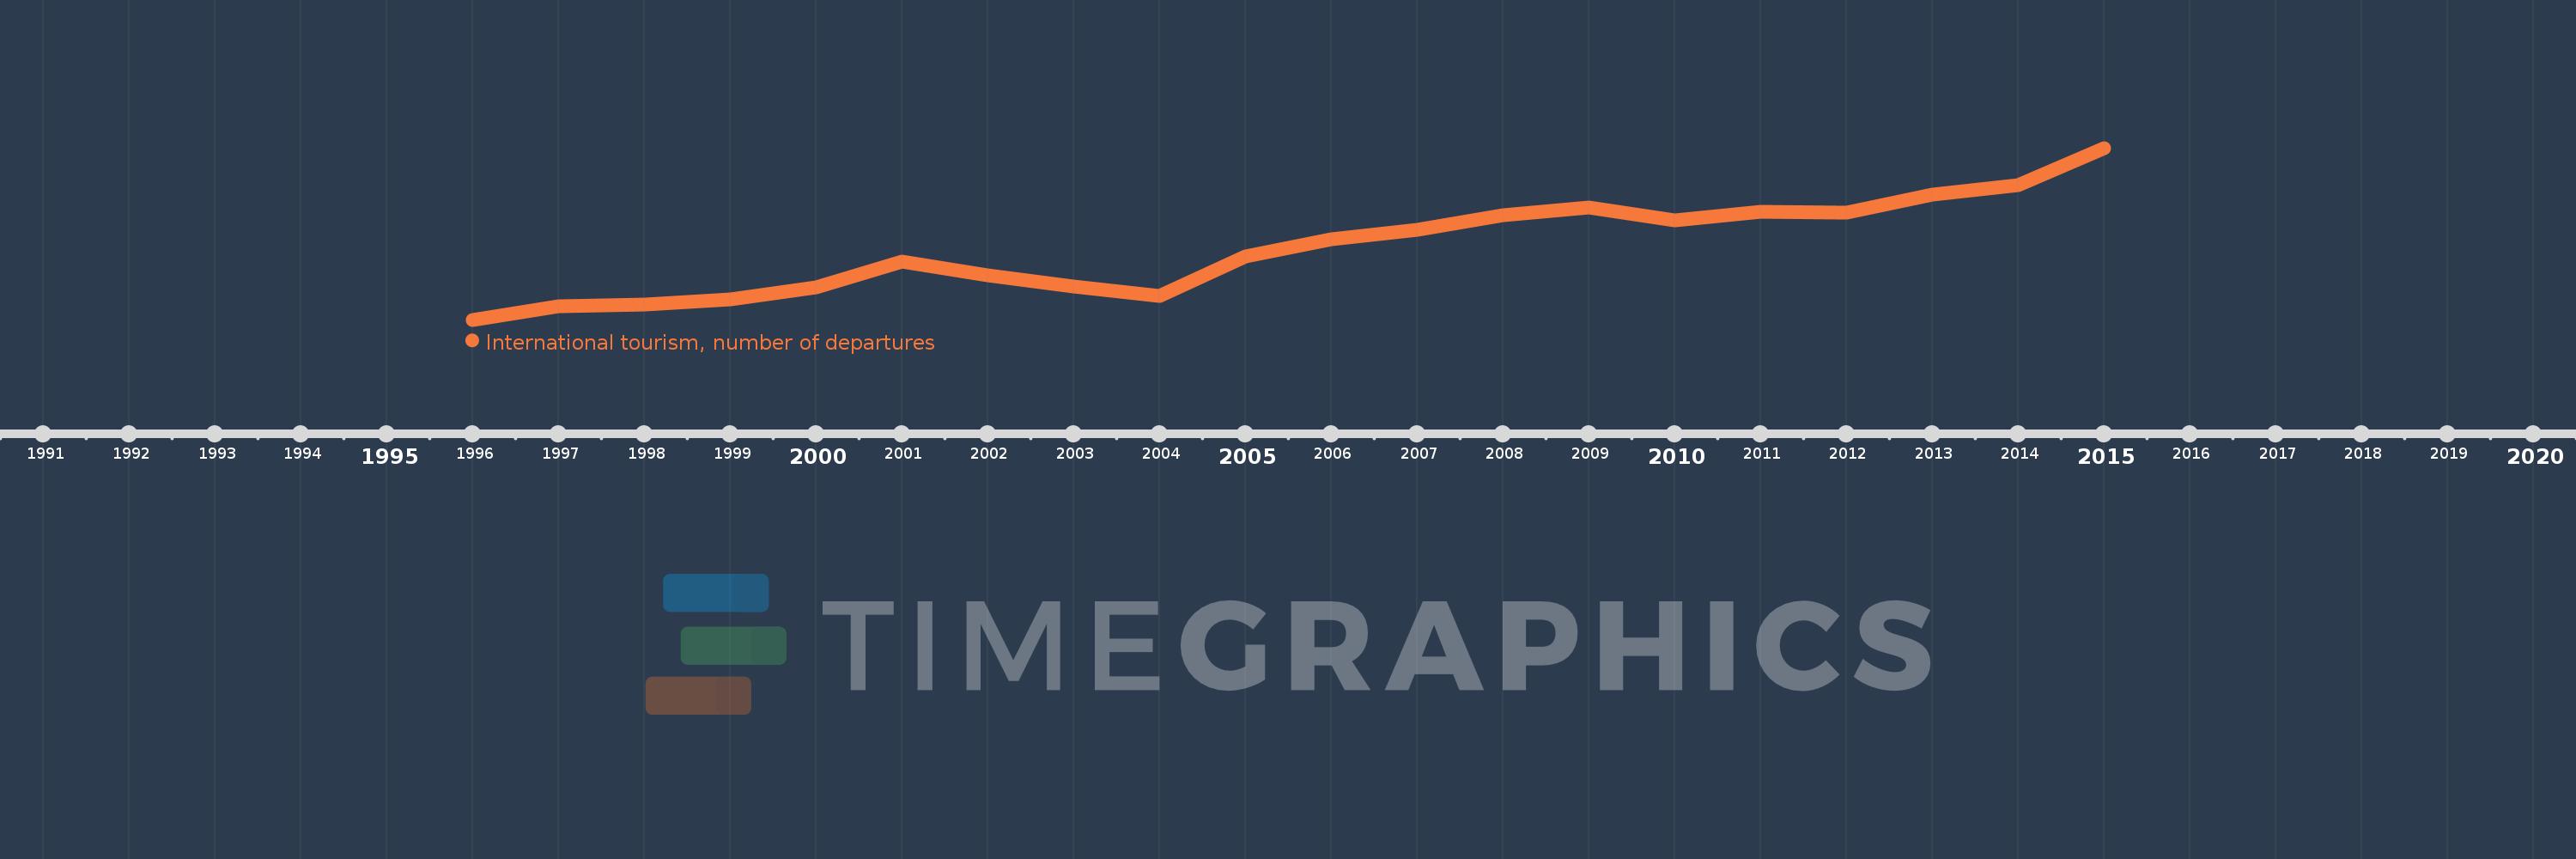
Cette échelle de temps montre un graphique de 1996 année à 2015 année North America. Les données jusqu'à 1995 année ne sont pas présentés. Quantité d'observations actuelles selon dates: 20.
Source (désignation):
Les indicateurs du développement mondiale
Source (organisation):
World Tourism Organization, Yearbook of Tourism Statistics, Compendium of Tourism Statistics and data files.
Catégories:
Private Sector, Trade
Dernière mise à jour
23 avr. 2017
Les indicateurs de changement de valeurs selon les années
En moyenne:
83.023 mln.
Minimum:
69.482 mln.
1 janv. 1996
Maximum:
101.84 mln.
1 janv. 2015
Pour la date d''observation
Valeur
Changement absolu
Le changement par rapport à la valeur précédente
1 janv. 1996
69.482 mln.
+69.482 mln.
0.0%
1 janv. 1997
71.963 mln.
+2.481 mln.
3.57%
1 janv. 1998
72.331 mln.
+367.953 milles
0.51%
1 janv. 1999
73.335 mln.
+1.004 mln.
1.39%
1 janv. 2000
75.58 mln.
+2.246 mln.
3.06%
1 janv. 2001
80.499 mln.
+4.918 mln.
6.51%
1 janv. 2002
77.791 mln.
-2.708 mln.
-3.36%
1 janv. 2003
75.77 mln.
-2.021 mln.
-2.6%
1 janv. 2004
73.987 mln.
-1.783 mln.
-2.35%
1 janv. 2005
81.403 mln.
+7.416 mln.
10.02%
1 janv. 2006
84.6 mln.
+3.197 mln.
3.93%
1 janv. 2007
86.398 mln.
+1.798 mln.
2.12%
1 janv. 2008
89.221 mln.
+2.824 mln.
3.27%
1 janv. 2009
90.704 mln.
+1.483 mln.
1.66%
1 janv. 2010
88.272 mln.
-2.432 mln.
-2.68%
1 janv. 2011
89.758 mln.
+1.486 mln.
1.68%
1 janv. 2012
89.676 mln.
-82.016 milles
-0.09%
1 janv. 2013
92.991 mln.
+3.315 mln.
3.7%
1 janv. 2014
94.863 mln.
+1.872 mln.
2.01%
1 janv. 2015
101.84 mln.
+6.977 mln.
7.36%
Classement des pays selon les statistiques actuelles par années