33
/fr/
AIzaSyAYiBZKx7MnpbEhh9jyipgxe19OcubqV5w
May 1, 2025
27406
East Asia & Pacific
EAS
false
2
1
International tourism, number of departures
2015,2014,2013,2012,2011,2010,2009,2008,2007,2006,2005,2004,2003,2002,2001,2000,1999
Download
Bibliothèque de statistiques globales →East Asia & Pacific →

International tourism, number of departures

Cette statistique dans les autres pays:

AlbaniaAlgeriaAngolaAntigua and BarbudaArgentinaArmeniaAustraliaAustriaAzerbaijanBangladeshBelarusBelgiumBermudaBoliviaBrazilBritish Virgin IslandsBulgariaBurundiCambodiaCanadaCentral African RepublicCentral Europe and the BalticsChadChileChinaColombiaCongo, Dem. Rep.Congo, Rep.Costa RicaCroatiaCubaCyprusCzech RepublicDenmarkDominican RepublicEarly-demographic dividendEast Asia & PacificEast Asia & Pacific (excluding high income)East Asia & Pacific (IDA & IBRD countries)EcuadorEgypt, Arab Rep.El SalvadorEstoniaEthiopiaEuro areaEurope & Central AsiaEurope & Central Asia (excluding high income)Europe & Central Asia (IDA & IBRD countries)European UnionFijiFinlandFranceFrench PolynesiaGabonGambia, TheGeorgiaGermanyGreeceGuatemalaHigh incomeHondurasHong Kong SAR, ChinaHungaryIBRD onlyIcelandIDA & IBRD totalIndiaIndonesiaIran, Islamic Rep.IrelandIsraelItalyJapanJordanKazakhstanKorea, Rep.KuwaitKyrgyz RepublicLao PDRLate-demographic dividendLatin America & Caribbean Latin America & Caribbean (excluding high income)Latin America & the Caribbean (IDA & IBRD countries)LatviaLibyaLithuaniaLow & middle incomeLower middle incomeLuxembourgMacao SAR, ChinaMadagascarMalaysiaMaldivesMaltaMauritiusMexicoMiddle incomeMoldovaMoroccoNepalNetherlandsNew CaledoniaNew ZealandNicaraguaNigerNorth AmericaNorwayOECD membersOmanPalauPanamaPapua New GuineaParaguayPeruPhilippinesPolandPortugalPost-demographic dividendPuerto RicoRomaniaRussian FederationSamoaSaudi ArabiaSeychellesSierra LeoneSingaporeSlovak RepublicSloveniaSouth AfricaSouth AsiaSouth Asia (IDA & IBRD)SpainSri LankaSudanSwazilandSwedenSwitzerlandSyrian Arab RepublicTajikistanTanzaniaThailandTrinidad and TobagoTunisiaTurkeyTurkmenistanTuvaluUgandaUkraineUnited KingdomUnited StatesUpper middle incomeUruguayUzbekistanVanuatuVenezuela, RBWorldZimbabwe

La ligne de temps

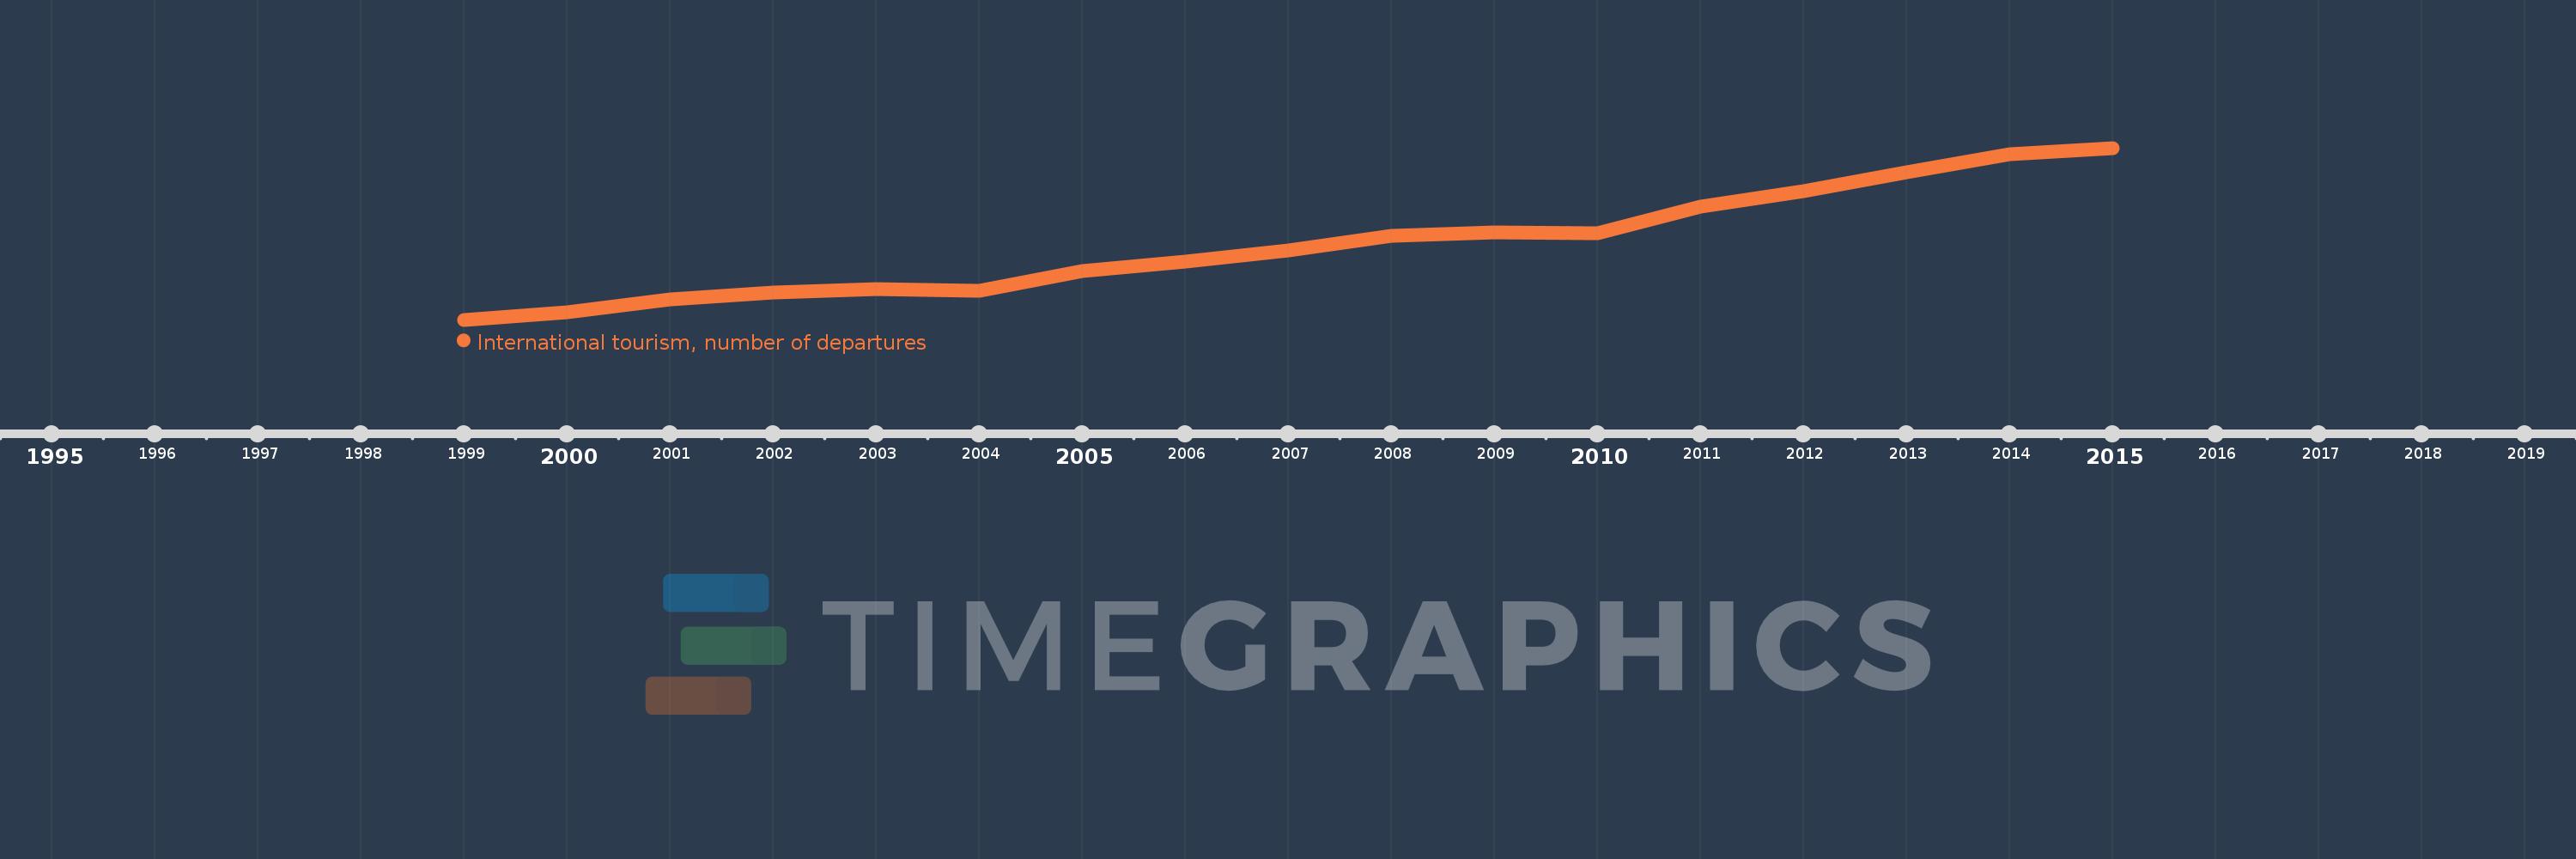
Cette échelle de temps montre un graphique de 1999 année à 2015 année East Asia & Pacific. Les données jusqu'à 1998 année ne sont pas présentés. Quantité d'observations actuelles selon dates: 17.

Source (désignation):

Les indicateurs du développement mondiale

Source (organisation):

World Tourism Organization, Yearbook of Tourism Statistics, Compendium of Tourism Statistics and data files.

Catégories:

Private Sector, Trade

Dernière mise à jour

23 avr. 2017

Les indicateurs de changement de valeurs selon les années

En moyenne:
199.659 mln.
Minimum:
111.03 mln.
1 janv. 1999
Maximum:
313.941 mln.
1 janv. 2015
Pour la date d''observation
Valeur
Changement absolu
Le changement par rapport à la valeur précédente
1 janv. 1999
111.03 mln.
+111.03 mln.
0.0%
1 janv. 2000
120.207 mln.
+9.178 mln.
8.27%
1 janv. 2001
135.134 mln.
+14.927 mln.
12.42%
1 janv. 2002
143.222 mln.
+8.088 mln.
5.99%
1 janv. 2003
147.23 mln.
+4.008 mln.
2.8%
1 janv. 2004
144.94 mln.
-2.29 mln.
-1.56%
1 janv. 2005
168.94 mln.
+24.0 mln.
16.56%
1 janv. 2006
179.444 mln.
+10.504 mln.
6.22%
1 janv. 2007
192.471 mln.
+13.027 mln.
7.26%
1 janv. 2008
209.703 mln.
+17.232 mln.
8.95%
1 janv. 2009
214.634 mln.
+4.931 mln.
2.35%
1 janv. 2010
213.311 mln.
-1.323 mln.
-0.62%
1 janv. 2011
244.827 mln.
+31.515 mln.
14.77%
1 janv. 2012
263.371 mln.
+18.544 mln.
7.57%
1 janv. 2013
285.482 mln.
+22.111 mln.
8.4%
1 janv. 2014
306.321 mln.
+20.839 mln.
7.3%
1 janv. 2015
313.941 mln.
+7.62 mln.
2.49%

Classement des pays selon les statistiques actuelles par années