33
/fr/
AIzaSyAYiBZKx7MnpbEhh9jyipgxe19OcubqV5w
August 1, 2025
40822
Late-demographic dividend
LTE
false
2
1
International tourism, number of departures
2015,2014,2013,2012,2011,2010,2009,2008,2007,2006,2005,2004,2003,2002,2001,2000,1999,1998,1997,1996
Download
Bibliothèque de statistiques globales →Late-demographic dividend →

International tourism, number of departures

Cette statistique dans les autres pays:

AlbaniaAlgeriaAngolaAntigua and BarbudaArgentinaArmeniaAustraliaAustriaAzerbaijanBangladeshBelarusBelgiumBermudaBoliviaBrazilBritish Virgin IslandsBulgariaBurundiCambodiaCanadaCentral African RepublicCentral Europe and the BalticsChadChileChinaColombiaCongo, Dem. Rep.Congo, Rep.Costa RicaCroatiaCubaCyprusCzech RepublicDenmarkDominican RepublicEarly-demographic dividendEast Asia & PacificEast Asia & Pacific (excluding high income)East Asia & Pacific (IDA & IBRD countries)EcuadorEgypt, Arab Rep.El SalvadorEstoniaEthiopiaEuro areaEurope & Central AsiaEurope & Central Asia (excluding high income)Europe & Central Asia (IDA & IBRD countries)European UnionFijiFinlandFranceFrench PolynesiaGabonGambia, TheGeorgiaGermanyGreeceGuatemalaHigh incomeHondurasHong Kong SAR, ChinaHungaryIBRD onlyIcelandIDA & IBRD totalIndiaIndonesiaIran, Islamic Rep.IrelandIsraelItalyJapanJordanKazakhstanKorea, Rep.KuwaitKyrgyz RepublicLao PDRLate-demographic dividendLatin America & Caribbean Latin America & Caribbean (excluding high income)Latin America & the Caribbean (IDA & IBRD countries)LatviaLibyaLithuaniaLow & middle incomeLower middle incomeLuxembourgMacao SAR, ChinaMadagascarMalaysiaMaldivesMaltaMauritiusMexicoMiddle incomeMoldovaMoroccoNepalNetherlandsNew CaledoniaNew ZealandNicaraguaNigerNorth AmericaNorwayOECD membersOmanPalauPanamaPapua New GuineaParaguayPeruPhilippinesPolandPortugalPost-demographic dividendPuerto RicoRomaniaRussian FederationSamoaSaudi ArabiaSeychellesSierra LeoneSingaporeSlovak RepublicSloveniaSouth AfricaSouth AsiaSouth Asia (IDA & IBRD)SpainSri LankaSudanSwazilandSwedenSwitzerlandSyrian Arab RepublicTajikistanTanzaniaThailandTrinidad and TobagoTunisiaTurkeyTurkmenistanTuvaluUgandaUkraineUnited KingdomUnited StatesUpper middle incomeUruguayUzbekistanVanuatuVenezuela, RBWorldZimbabwe

La ligne de temps

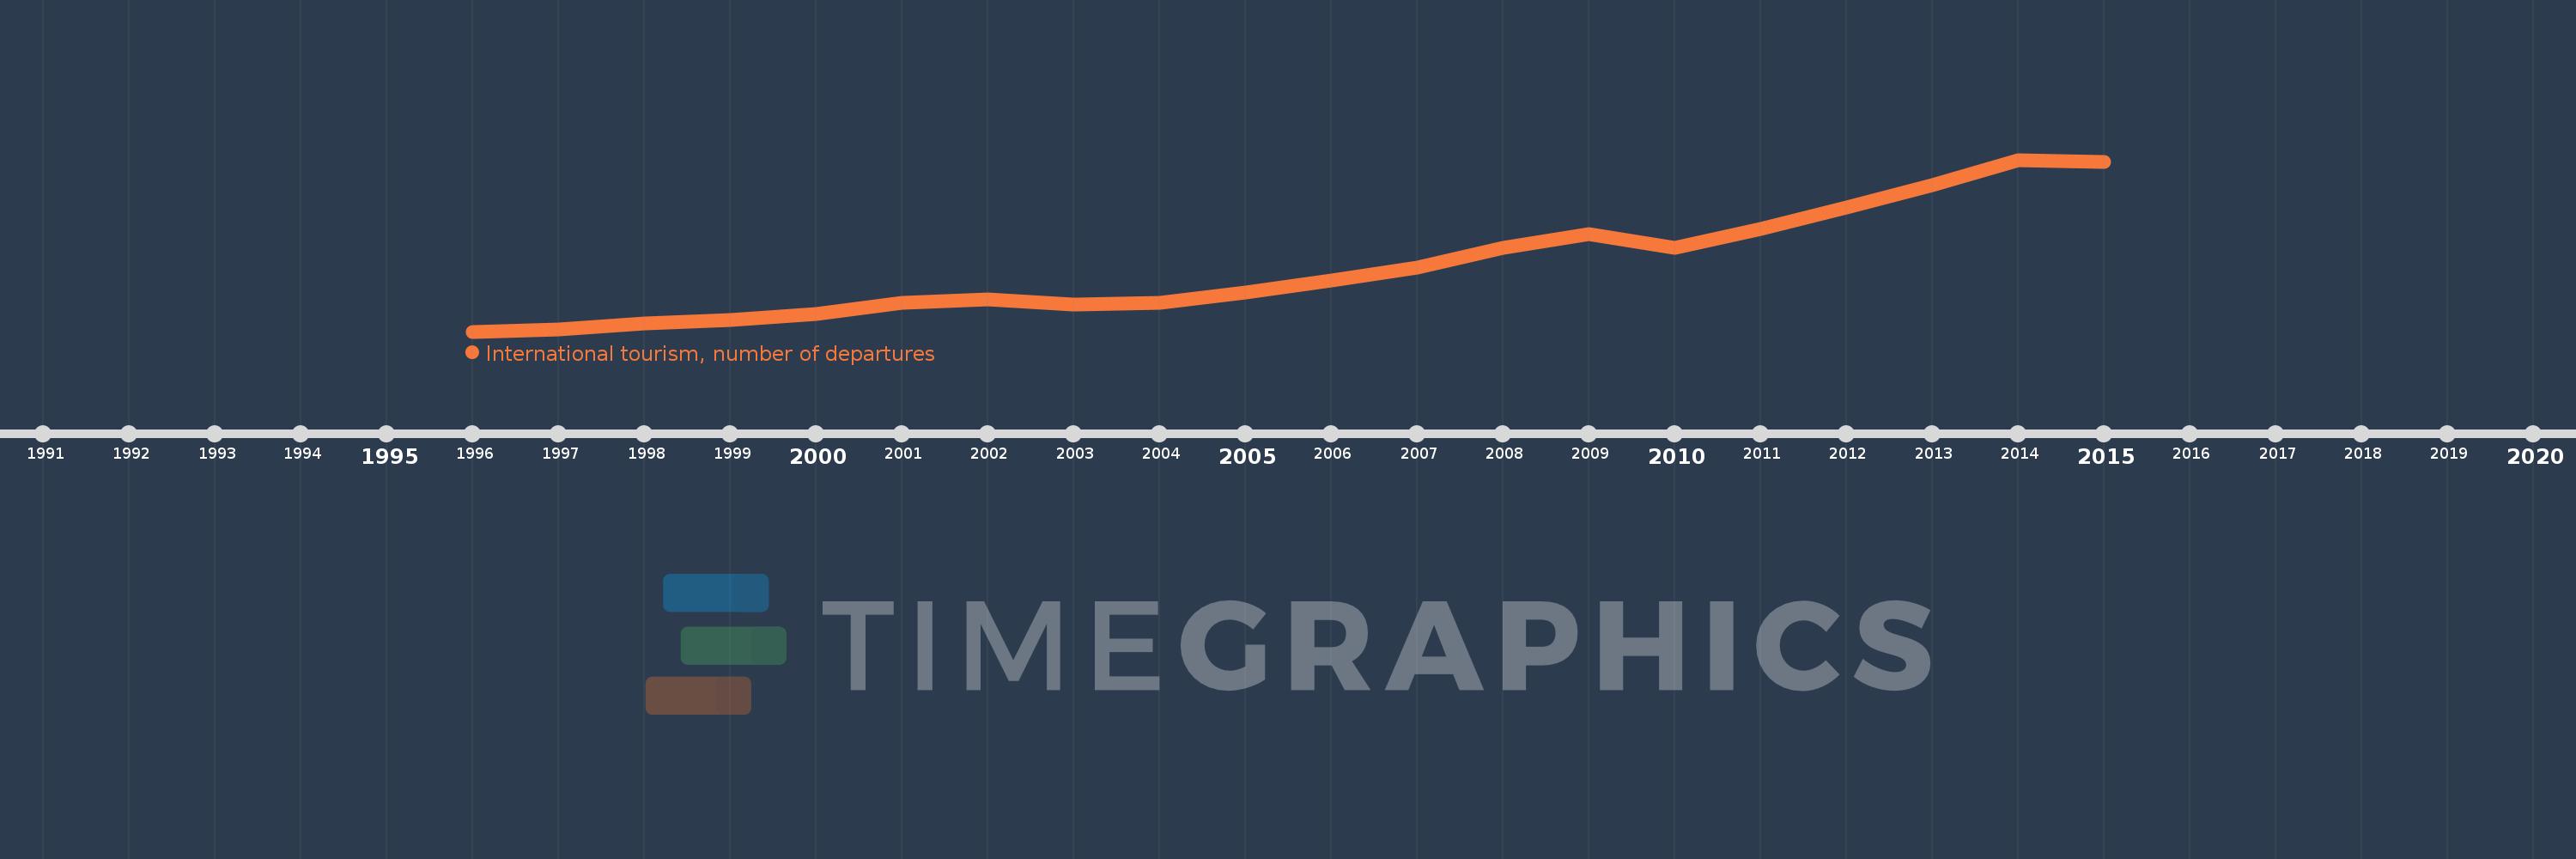
Cette échelle de temps montre un graphique de 1996 année à 2015 année Late-demographic dividend. Les données jusqu'à 1995 année ne sont pas présentés. Quantité d'observations actuelles selon dates: 20.

Source (désignation):

Les indicateurs du développement mondiale

Source (organisation):

World Tourism Organization, Yearbook of Tourism Statistics, Compendium of Tourism Statistics and data files.

Catégories:

Private Sector, Trade

Dernière mise à jour

23 avr. 2017

Les indicateurs de changement de valeurs selon les années

En moyenne:
179.403 mln.
Minimum:
98.623 mln.
1 janv. 1996
Maximum:
313.799 mln.
1 janv. 2014
Pour la date d''observation
Valeur
Changement absolu
Le changement par rapport à la valeur précédente
1 janv. 1996
98.623 mln.
+98.623 mln.
0.0%
1 janv. 1997
101.583 mln.
+2.96 mln.
3.0%
1 janv. 1998
108.388 mln.
+6.806 mln.
6.7%
1 janv. 1999
112.906 mln.
+4.517 mln.
4.17%
1 janv. 2000
120.335 mln.
+7.429 mln.
6.58%
1 janv. 2001
134.538 mln.
+14.203 mln.
11.8%
1 janv. 2002
138.984 mln.
+4.446 mln.
3.3%
1 janv. 2003
132.25 mln.
-6.734 mln.
-4.85%
1 janv. 2004
134.821 mln.
+2.571 mln.
1.94%
1 janv. 2005
147.679 mln.
+12.858 mln.
9.54%
1 janv. 2006
162.794 mln.
+15.115 mln.
10.23%
1 janv. 2007
178.72 mln.
+15.926 mln.
9.78%
1 janv. 2008
203.412 mln.
+24.692 mln.
13.82%
1 janv. 2009
220.59 mln.
+17.178 mln.
8.45%
1 janv. 2010
203.73 mln.
-16.86 mln.
-7.64%
1 janv. 2011
227.321 mln.
+23.591 mln.
11.58%
1 janv. 2012
254.572 mln.
+27.25 mln.
11.99%
1 janv. 2013
281.96 mln.
+27.388 mln.
10.76%
1 janv. 2014
313.799 mln.
+31.839 mln.
11.29%
1 janv. 2015
311.053 mln.
-2.746 mln.
-0.88%

Classement des pays selon les statistiques actuelles par années