29
/fr/
fr
AIzaSyAYiBZKx7MnpbEhh9jyipgxe19OcubqV5w
April 1, 2024
229940
Russian Federation
RUS
true
2
1
International tourism, number of departures
2015,2014,2013,2012,2011,2010,2009,2008,2007,2006,2005,2004,2003,2002,2001,2000,1999,1998,1997,1996
Download
Bibliothèque de statistiques globales →Russian Federation →

International tourism, number of departures

Cette statistique dans les autres pays:
AlbaniaAlgeriaAngolaAntigua and BarbudaArgentinaArmeniaAustraliaAustriaAzerbaijanBangladeshBelarusBelgiumBermudaBoliviaBrazilBritish Virgin IslandsBulgariaBurundiCambodiaCanadaCentral African RepublicCentral Europe and the BalticsChadChileChinaColombiaCongo, Dem. Rep.Congo, Rep.Costa RicaCroatiaCubaCyprusCzech RepublicDenmarkDominican RepublicEarly-demographic dividendEast Asia & PacificEast Asia & Pacific (excluding high income)East Asia & Pacific (IDA & IBRD countries)EcuadorEgypt, Arab Rep.El SalvadorEstoniaEthiopiaEuro areaEurope & Central AsiaEurope & Central Asia (excluding high income)Europe & Central Asia (IDA & IBRD countries)European UnionFijiFinlandFranceFrench PolynesiaGabonGambia, TheGeorgiaGermanyGreeceGuatemalaHigh incomeHondurasHong Kong SAR, ChinaHungaryIBRD onlyIcelandIDA & IBRD totalIndiaIndonesiaIran, Islamic Rep.IrelandIsraelItalyJapanJordanKazakhstanKorea, Rep.KuwaitKyrgyz RepublicLao PDRLate-demographic dividendLatin America & Caribbean Latin America & Caribbean (excluding high income)Latin America & the Caribbean (IDA & IBRD countries)LatviaLibyaLithuaniaLow & middle incomeLower middle incomeLuxembourgMacao SAR, ChinaMadagascarMalaysiaMaldivesMaltaMauritiusMexicoMiddle incomeMoldovaMoroccoNepalNetherlandsNew CaledoniaNew ZealandNicaraguaNigerNorth AmericaNorwayOECD membersOmanPalauPanamaPapua New GuineaParaguayPeruPhilippinesPolandPortugalPost-demographic dividendPuerto RicoRomaniaRussian FederationSamoaSaudi ArabiaSeychellesSierra LeoneSingaporeSlovak RepublicSloveniaSouth AfricaSouth AsiaSouth Asia (IDA & IBRD)SpainSri LankaSudanSwazilandSwedenSwitzerlandSyrian Arab RepublicTajikistanTanzaniaThailandTrinidad and TobagoTunisiaTurkeyTurkmenistanTuvaluUgandaUkraineUnited KingdomUnited StatesUpper middle incomeUruguayUzbekistanVanuatuVenezuela, RBWorldZimbabwe
La ligne de temps
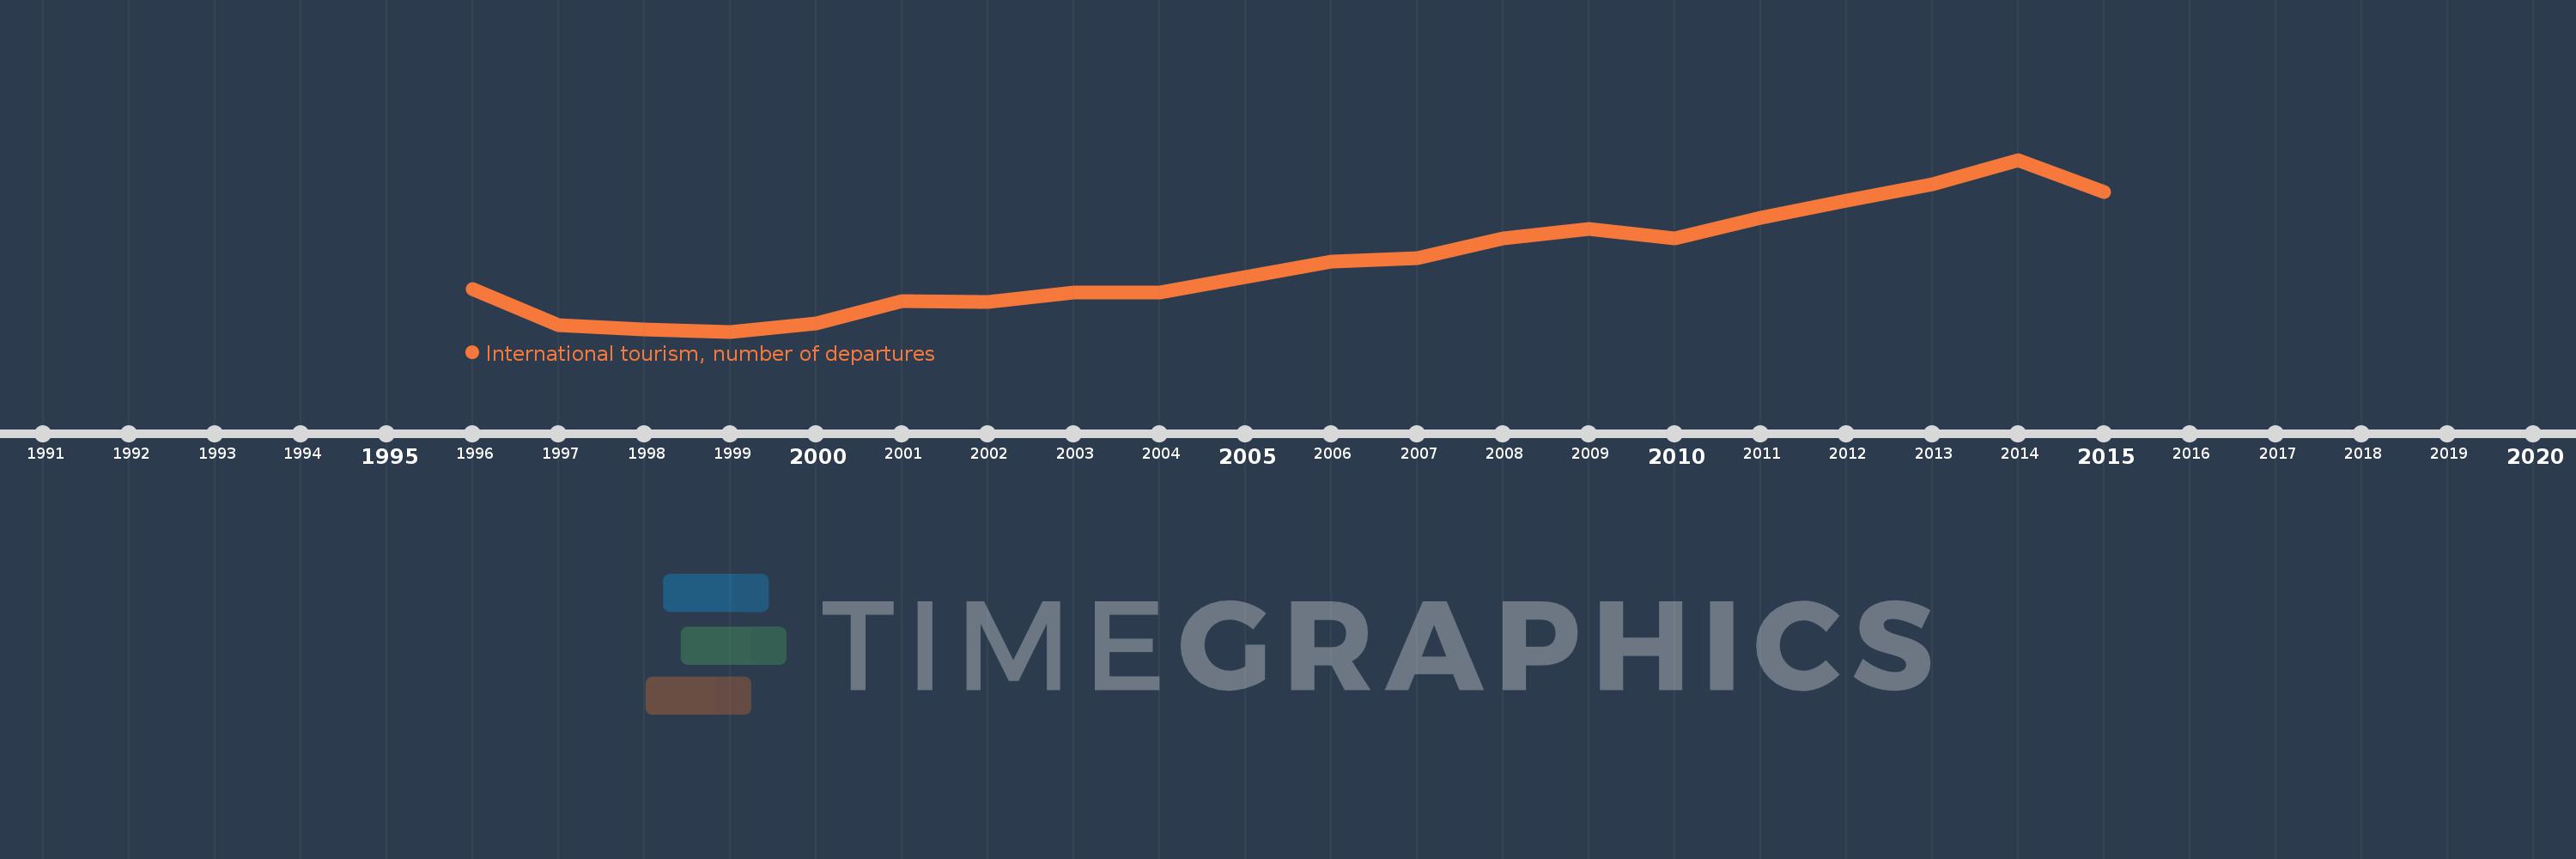
Cette échelle de temps montre un graphique de 1996 année à 2015 année Russian Federation. Les données jusqu'à 1995 année ne sont pas présentés. Quantité d'observations actuelles selon dates: 20.
Source (désignation):
Les indicateurs du développement mondiale
Source (organisation):
World Tourism Organization, Yearbook of Tourism Statistics, Compendium of Tourism Statistics and data files.
Catégories:
Private Sector, Trade
Dernière mise à jour
23 avr. 2017
Les indicateurs de changement de valeurs selon les années
En moyenne:
28.169 mln.
Minimum:
10.635 mln.
1 janv. 1999
Maximum:
54.069 mln.
1 janv. 2014
Pour la date d''observation
Valeur
Changement absolu
Le changement par rapport à la valeur précédente
1 janv. 1996
21.329 mln.
+21.329 mln.
0.0%
1 janv. 1997
12.26 mln.
-9.069 mln.
-42.52%
1 janv. 1998
11.182 mln.
-1.078 mln.
-8.79%
1 janv. 1999
10.635 mln.
-547.0 milles
-4.89%
1 janv. 2000
12.631 mln.
+1.996 mln.
18.77%
1 janv. 2001
18.371 mln.
+5.74 mln.
45.44%
1 janv. 2002
18.03 mln.
-341.0 milles
-1.86%
1 janv. 2003
20.428 mln.
+2.398 mln.
13.3%
1 janv. 2004
20.572 mln.
+144.0 milles
0.7%
1 janv. 2005
24.507 mln.
+3.935 mln.
19.13%
1 janv. 2006
28.416 mln.
+3.909 mln.
15.95%
1 janv. 2007
29.107 mln.
+691.0 milles
2.43%
1 janv. 2008
34.285 mln.
+5.178 mln.
17.79%
1 janv. 2009
36.538 mln.
+2.253 mln.
6.57%
1 janv. 2010
34.276 mln.
-2.262 mln.
-6.19%
1 janv. 2011
39.323 mln.
+5.047 mln.
14.72%
1 janv. 2012
43.726 mln.
+4.403 mln.
11.2%
1 janv. 2013
47.813 mln.
+4.087 mln.
9.35%
1 janv. 2014
54.069 mln.
+6.256 mln.
13.08%
1 janv. 2015
45.889 mln.
-8.18 mln.
-15.13%
Classement des pays selon les statistiques actuelles par années

Commentaires:

Envoyer
PremiumAbout & FeedbackUn accordConfidentialité
logo
© 2022 Selected Technologies LLC – Morgan Hill, California