29
/fr/
fr
AIzaSyAYiBZKx7MnpbEhh9jyipgxe19OcubqV5w
April 1, 2024
36689
IBRD only
IBD
false
2
1
International tourism, number of departures
2015,2014,2013,2012,2011,2010,2009,2008,2007,2006,2005,2004,2003,2002,2001,2000,1999,1998,1997,1996
Download
Bibliothèque de statistiques globales →IBRD only →

International tourism, number of departures

Cette statistique dans les autres pays:
AlbaniaAlgeriaAngolaAntigua and BarbudaArgentinaArmeniaAustraliaAustriaAzerbaijanBangladeshBelarusBelgiumBermudaBoliviaBrazilBritish Virgin IslandsBulgariaBurundiCambodiaCanadaCentral African RepublicCentral Europe and the BalticsChadChileChinaColombiaCongo, Dem. Rep.Congo, Rep.Costa RicaCroatiaCubaCyprusCzech RepublicDenmarkDominican RepublicEarly-demographic dividendEast Asia & PacificEast Asia & Pacific (excluding high income)East Asia & Pacific (IDA & IBRD countries)EcuadorEgypt, Arab Rep.El SalvadorEstoniaEthiopiaEuro areaEurope & Central AsiaEurope & Central Asia (excluding high income)Europe & Central Asia (IDA & IBRD countries)European UnionFijiFinlandFranceFrench PolynesiaGabonGambia, TheGeorgiaGermanyGreeceGuatemalaHigh incomeHondurasHong Kong SAR, ChinaHungaryIBRD onlyIcelandIDA & IBRD totalIndiaIndonesiaIran, Islamic Rep.IrelandIsraelItalyJapanJordanKazakhstanKorea, Rep.KuwaitKyrgyz RepublicLao PDRLate-demographic dividendLatin America & Caribbean Latin America & Caribbean (excluding high income)Latin America & the Caribbean (IDA & IBRD countries)LatviaLibyaLithuaniaLow & middle incomeLower middle incomeLuxembourgMacao SAR, ChinaMadagascarMalaysiaMaldivesMaltaMauritiusMexicoMiddle incomeMoldovaMoroccoNepalNetherlandsNew CaledoniaNew ZealandNicaraguaNigerNorth AmericaNorwayOECD membersOmanPalauPanamaPapua New GuineaParaguayPeruPhilippinesPolandPortugalPost-demographic dividendPuerto RicoRomaniaRussian FederationSamoaSaudi ArabiaSeychellesSierra LeoneSingaporeSlovak RepublicSloveniaSouth AfricaSouth AsiaSouth Asia (IDA & IBRD)SpainSri LankaSudanSwazilandSwedenSwitzerlandSyrian Arab RepublicTajikistanTanzaniaThailandTrinidad and TobagoTunisiaTurkeyTurkmenistanTuvaluUgandaUkraineUnited KingdomUnited StatesUpper middle incomeUruguayUzbekistanVanuatuVenezuela, RBWorldZimbabwe
La ligne de temps
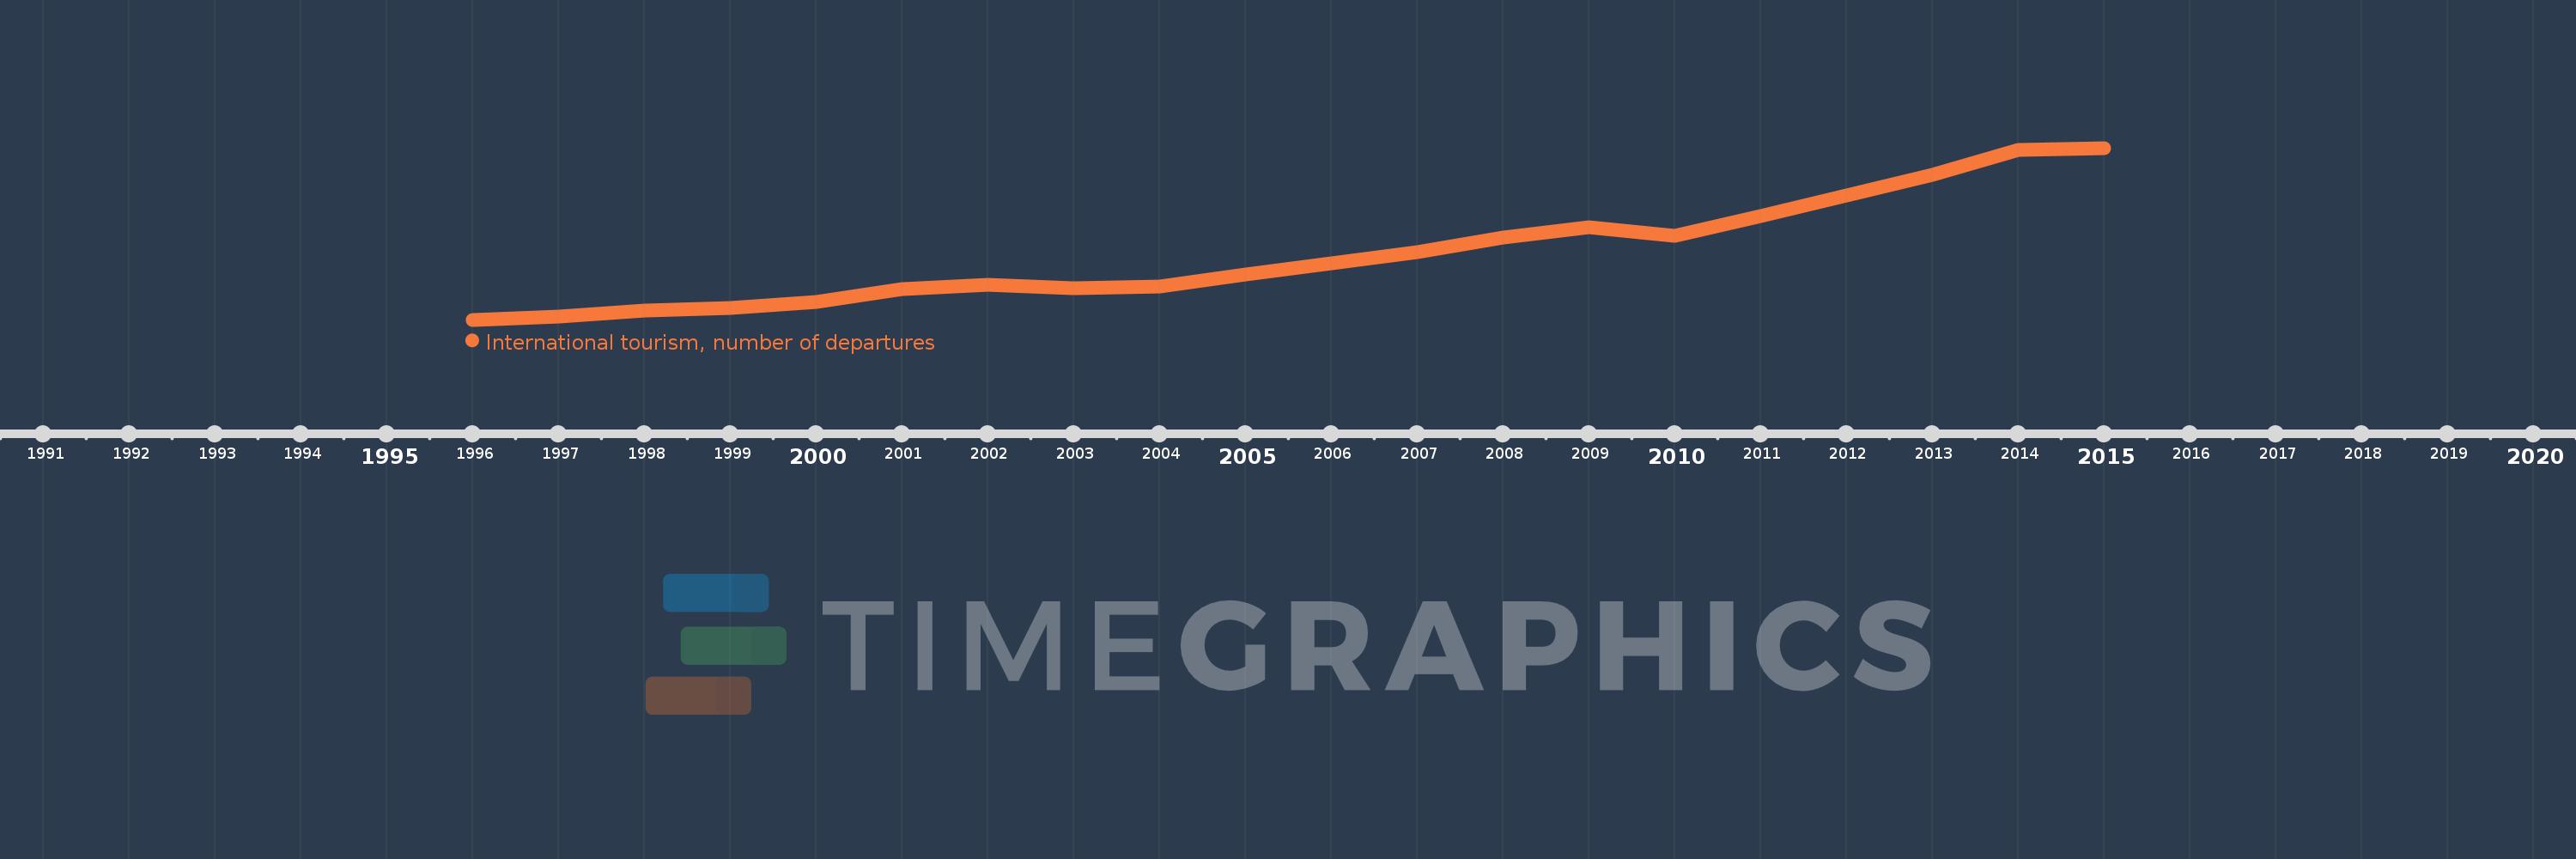
Cette échelle de temps montre un graphique de 1996 année à 2015 année IBRD only. Les données jusqu'à 1995 année ne sont pas présentés. Quantité d'observations actuelles selon dates: 20.
Source (désignation):
Les indicateurs du développement mondiale
Source (organisation):
World Tourism Organization, Yearbook of Tourism Statistics, Compendium of Tourism Statistics and data files.
Catégories:
Private Sector, Trade
Dernière mise à jour
23 avr. 2017
Les indicateurs de changement de valeurs selon les années
En moyenne:
238.409 mln.
Minimum:
130.9 mln.
1 janv. 1996
Maximum:
411.749 mln.
1 janv. 2015
Pour la date d''observation
Valeur
Changement absolu
Le changement par rapport à la valeur précédente
1 janv. 1996
130.9 mln.
+130.9 mln.
0.0%
1 janv. 1997
135.698 mln.
+4.798 mln.
3.67%
1 janv. 1998
146.601 mln.
+10.903 mln.
8.03%
1 janv. 1999
150.778 mln.
+4.177 mln.
2.85%
1 janv. 2000
159.377 mln.
+8.6 mln.
5.7%
1 janv. 2001
181.519 mln.
+22.141 mln.
13.89%
1 janv. 2002
188.502 mln.
+6.983 mln.
3.85%
1 janv. 2003
182.146 mln.
-6.355 mln.
-3.37%
1 janv. 2004
184.912 mln.
+2.765 mln.
1.52%
1 janv. 2005
204.684 mln.
+19.773 mln.
10.69%
1 janv. 2006
223.726 mln.
+19.041 mln.
9.3%
1 janv. 2007
241.165 mln.
+17.439 mln.
7.8%
1 janv. 2008
265.163 mln.
+23.998 mln.
9.95%
1 janv. 2009
282.536 mln.
+17.373 mln.
6.55%
1 janv. 2010
268.484 mln.
-14.052 mln.
-4.97%
1 janv. 2011
300.897 mln.
+32.413 mln.
12.07%
1 janv. 2012
333.406 mln.
+32.509 mln.
10.8%
1 janv. 2013
367.68 mln.
+34.275 mln.
10.28%
1 janv. 2014
408.257 mln.
+40.576 mln.
11.04%
1 janv. 2015
411.749 mln.
+3.493 mln.
0.86%
Classement des pays selon les statistiques actuelles par années

Commentaires:

Envoyer
PremiumAbout & FeedbackUn accordConfidentialité
logo
© 2022 Selected Technologies LLC – Morgan Hill, California