33
/de/
AIzaSyAYiBZKx7MnpbEhh9jyipgxe19OcubqV5w
May 1, 2025
203373
Mozambique
MOZ
true
2
1
Percentage of female teachers in primary education who are trained, female (%)
2015,2014,2013,2012,2011,2010,2009,2008,2007,2006
Download
Bibliothek der Globalstatistik →Mozambique →

Percentage of female teachers in primary education who are trained, female (%)

Diese Statistik in anderen Ländern:

AlgeriaAndorraAngolaAntigua and BarbudaArab WorldArmeniaArubaAzerbaijanBahamas, TheBahrainBangladeshBarbadosBelarusBelizeBeninBermudaBhutanBoliviaBotswanaBritish Virgin IslandsBrunei DarussalamBurkina FasoBurundiCabo VerdeCambodiaCameroonCaribbean small statesCayman IslandsCentral African RepublicColombiaComorosCongo, Dem. Rep.Congo, Rep.Costa RicaCote d'IvoireCroatiaCubaDjiboutiDominicaDominican RepublicEcuadorEgypt, Arab Rep.El SalvadorEquatorial GuineaEritreaEthiopiaFijiFragile and conflict affected situationsGabonGambia, TheGeorgiaGhanaGibraltarGrenadaGuineaGuinea-BissauGuyanaHeavily indebted poor countries (HIPC)HondurasHong Kong SAR, ChinaIDA blendIDA onlyIDA totalIran, Islamic Rep.IraqJamaicaKazakhstanKenyaKiribatiKuwaitKyrgyz RepublicLao PDRLeast developed countries: UN classificationLebanonLesothoLiberiaLow incomeMacao SAR, ChinaMadagascarMalawiMalaysiaMaldivesMaliMauritaniaMauritiusMiddle East & North AfricaMiddle East & North Africa (excluding high income)Middle East & North Africa (IDA & IBRD countries)MoldovaMongoliaMoroccoMozambiqueMyanmarNamibiaNauruNepalNicaraguaNigerNigeriaOmanOther small statesPacific island small statesPakistanPanamaParaguayPhilippinesPre-demographic dividendQatarRwandaSao Tome and PrincipeSaudi ArabiaSenegalSerbiaSeychellesSierra LeoneSingaporeSmall statesSolomon IslandsSouth AfricaSt. Kitts and NevisSt. LuciaSt. Vincent and the GrenadinesSub-Saharan Africa Sub-Saharan Africa (excluding high income)Sub-Saharan Africa (IDA & IBRD countries)SurinameSwazilandSyrian Arab RepublicTajikistanTanzaniaTogoTongaTrinidad and TobagoTunisiaTurks and Caicos IslandsUgandaUnited Arab EmiratesUzbekistanVietnamWest Bank and GazaZambiaZimbabwe

Zeitlinie:

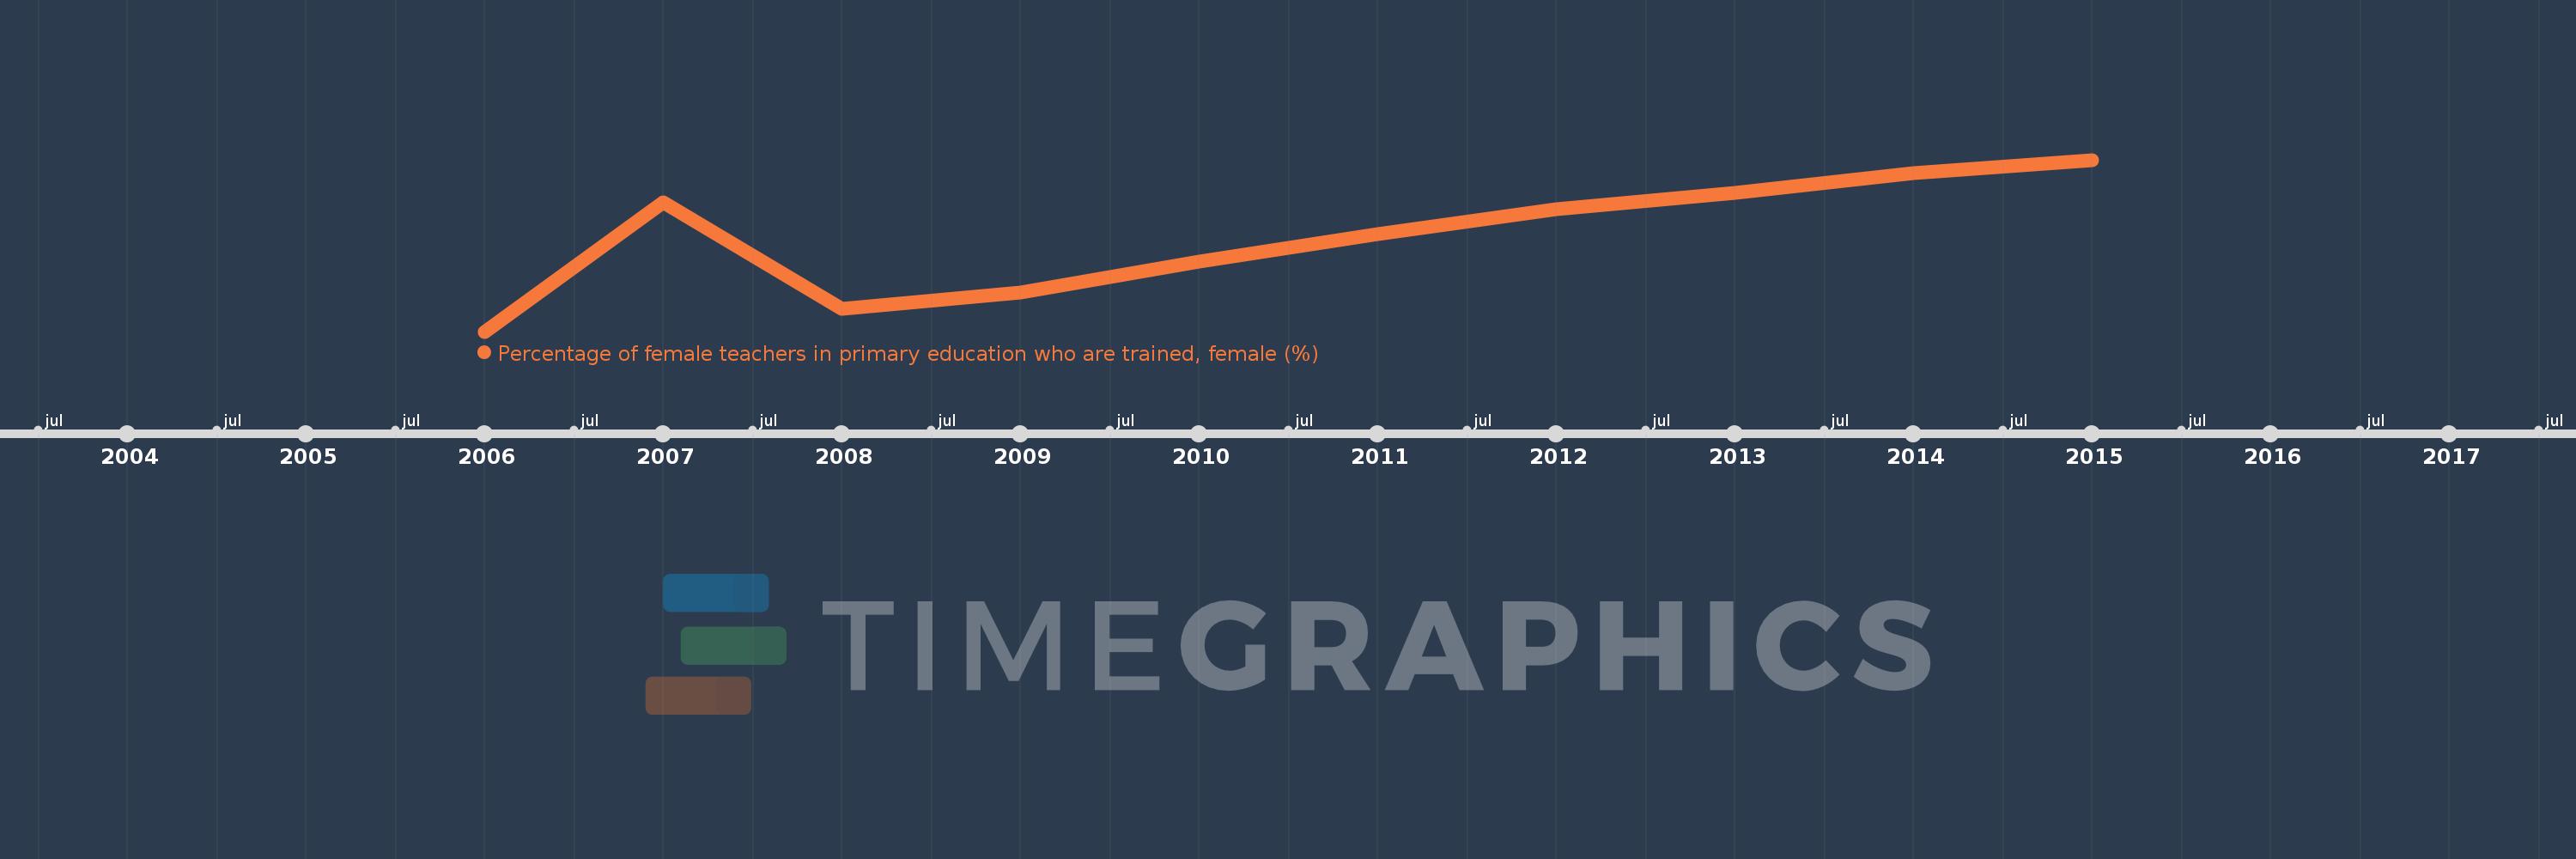
Diese Zeitleiste vorliegt die Graphik ab 2006 J. bis 2015 J. Mozambique. Die Angaben bis 2005 J. sind nicht vorhanden. Die Zahl aktueller Beobachtungen nach Daten: 10.

Die Quelle (Bezeichnung):

Kennzahlen der Weltentwicklung

Die Quelle (Einrichtung):

United Nations Educational, Scientific, and Cultural Organization (UNESCO) Institute for Statistics.

Kategorien:

Education, Gender

Es wurde aktualisiert:

23 Apr 2017 Jahr

Kennzahlen der Wertänderungen vom Jahr zum Jahr

im Durchschnitt:
81.142
Minimum:
67.402
1 Jan 2006 Jahr
Maximum:
92.277
1 Jan 2015 Jahr
Zum Datum der Beobachtung
Wert
Absolute Veränderung
Die Veränderung bezüglich dem vorherigen Wert
1 Jan 2006 Jahr
67.402
+67.402
0.0%
1 Jan 2007 Jahr
86.103
+18.702
27.75%
1 Jan 2008 Jahr
70.74
-15.364
-17.84%
1 Jan 2009 Jahr
73.014
+2.274
3.21%
1 Jan 2010 Jahr
77.497
+4.484
6.14%
1 Jan 2011 Jahr
81.459
+3.961
5.11%
1 Jan 2012 Jahr
85.098
+3.639
4.47%
1 Jan 2013 Jahr
87.463
+2.365
2.78%
1 Jan 2014 Jahr
90.364
+2.901
3.32%
1 Jan 2015 Jahr
92.277
+1.913
2.12%

Bewertung der Länder gemäß mit laufender Statistik nach Jahren