29
/de/
de
AIzaSyAYiBZKx7MnpbEhh9jyipgxe19OcubqV5w
April 1, 2024
148363
Guyana
GUY
true
2
1
Percentage of female teachers in primary education who are trained, female (%)
2013,2012,2011,2010,2009,2008,2006,2004,2002,2001,2000
Download
Bibliothek der Globalstatistik →Guyana →

Percentage of female teachers in primary education who are trained, female (%)

Diese Statistik in anderen Ländern:
AlgeriaAndorraAngolaAntigua and BarbudaArab WorldArmeniaArubaAzerbaijanBahamas, TheBahrainBangladeshBarbadosBelarusBelizeBeninBermudaBhutanBoliviaBotswanaBritish Virgin IslandsBrunei DarussalamBurkina FasoBurundiCabo VerdeCambodiaCameroonCaribbean small statesCayman IslandsCentral African RepublicColombiaComorosCongo, Dem. Rep.Congo, Rep.Costa RicaCote d'IvoireCroatiaCubaDjiboutiDominicaDominican RepublicEcuadorEgypt, Arab Rep.El SalvadorEquatorial GuineaEritreaEthiopiaFijiFragile and conflict affected situationsGabonGambia, TheGeorgiaGhanaGibraltarGrenadaGuineaGuinea-BissauGuyanaHeavily indebted poor countries (HIPC)HondurasHong Kong SAR, ChinaIDA blendIDA onlyIDA totalIran, Islamic Rep.IraqJamaicaKazakhstanKenyaKiribatiKuwaitKyrgyz RepublicLao PDRLeast developed countries: UN classificationLebanonLesothoLiberiaLow incomeMacao SAR, ChinaMadagascarMalawiMalaysiaMaldivesMaliMauritaniaMauritiusMiddle East & North AfricaMiddle East & North Africa (excluding high income)Middle East & North Africa (IDA & IBRD countries)MoldovaMongoliaMoroccoMozambiqueMyanmarNamibiaNauruNepalNicaraguaNigerNigeriaOmanOther small statesPacific island small statesPakistanPanamaParaguayPhilippinesPre-demographic dividendQatarRwandaSao Tome and PrincipeSaudi ArabiaSenegalSerbiaSeychellesSierra LeoneSingaporeSmall statesSolomon IslandsSouth AfricaSt. Kitts and NevisSt. LuciaSt. Vincent and the GrenadinesSub-Saharan Africa Sub-Saharan Africa (excluding high income)Sub-Saharan Africa (IDA & IBRD countries)SurinameSwazilandSyrian Arab RepublicTajikistanTanzaniaTogoTongaTrinidad and TobagoTunisiaTurks and Caicos IslandsUgandaUnited Arab EmiratesUzbekistanVietnamWest Bank and GazaZambiaZimbabwe
Zeitlinie:
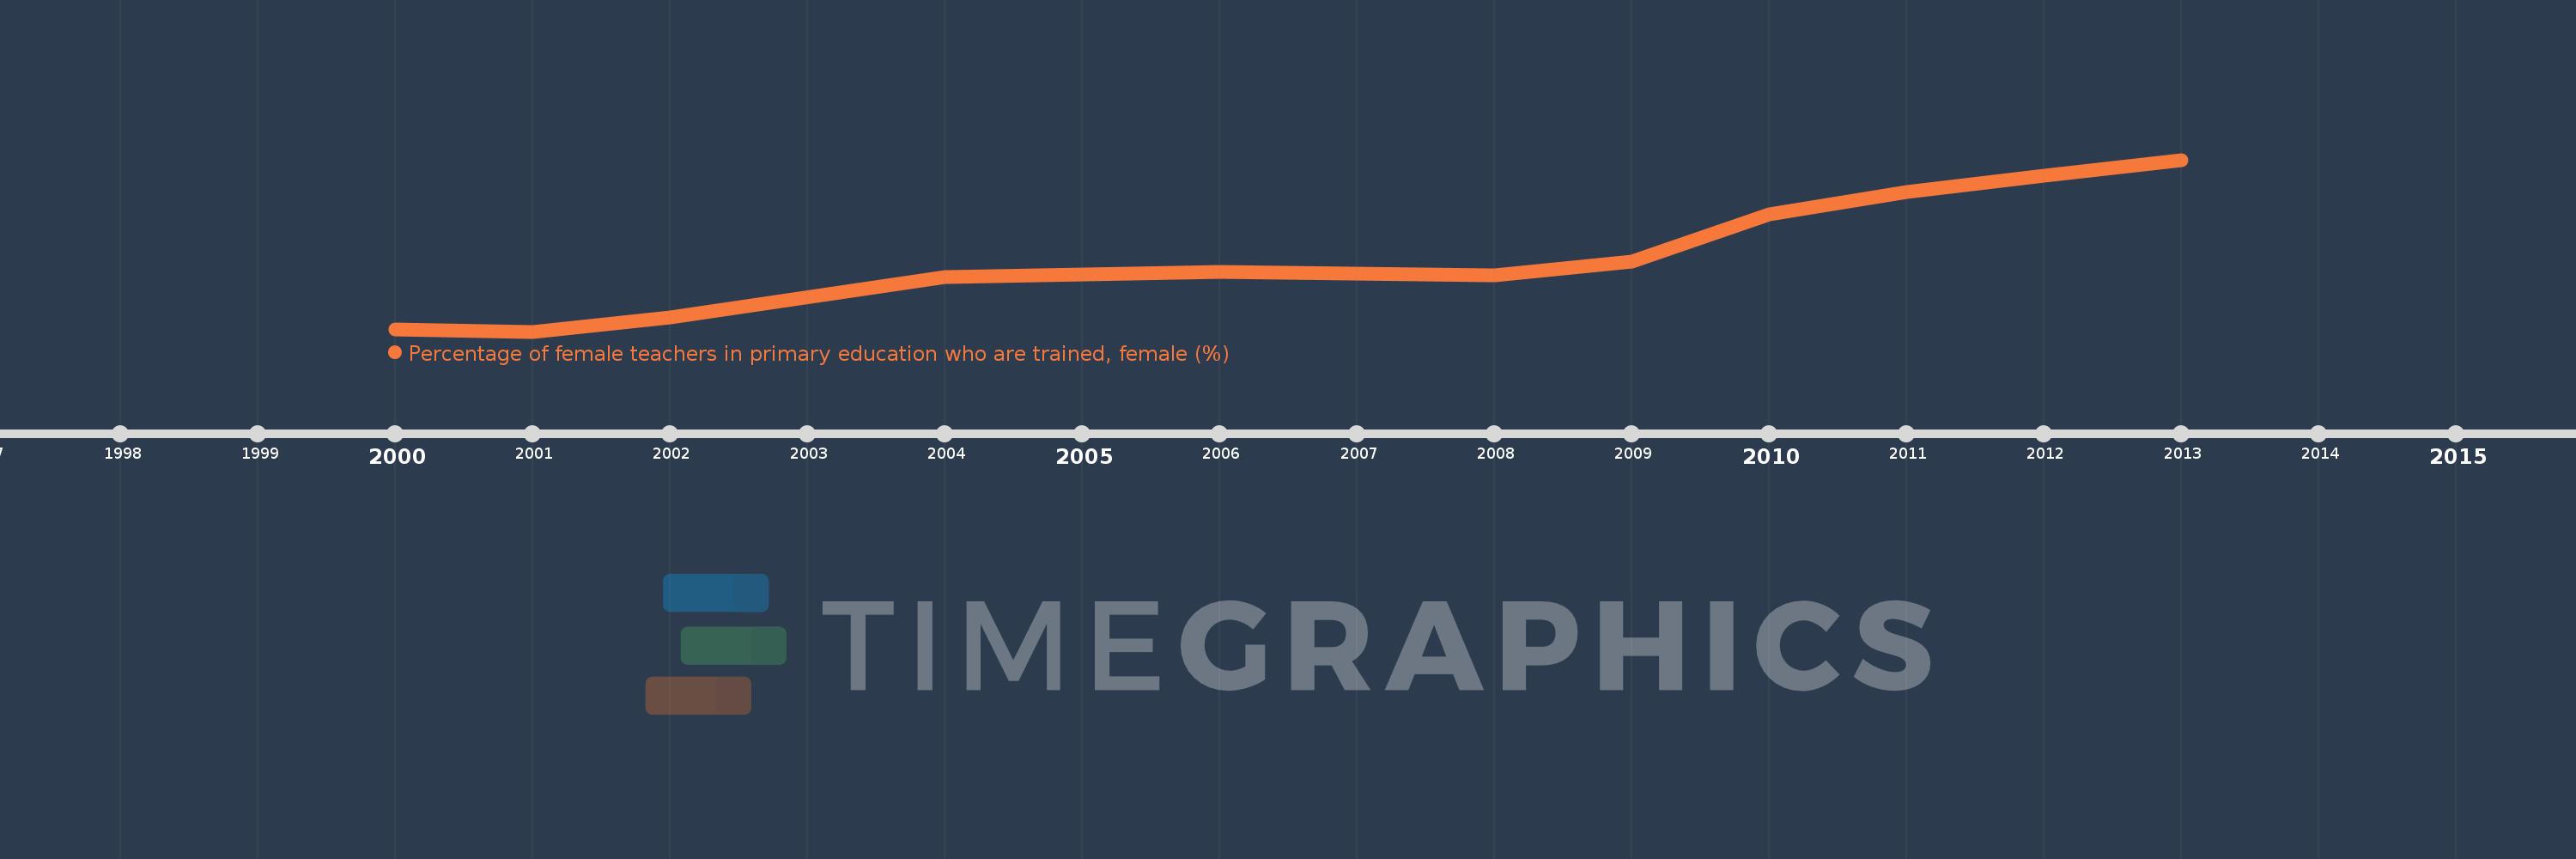
Diese Zeitleiste vorliegt die Graphik ab 2000 J. bis 2013 J. Guyana. Die Angaben bis 1999 J. sind nicht vorhanden. Die Zahl aktueller Beobachtungen nach Daten: 11.
Die Quelle (Bezeichnung):
Kennzahlen der Weltentwicklung
Die Quelle (Einrichtung):
United Nations Educational, Scientific, and Cultural Organization (UNESCO) Institute for Statistics.
Kategorien:
Education, Gender
Es wurde aktualisiert:
23 Apr 2017 Jahr
Kennzahlen der Wertänderungen vom Jahr zum Jahr
im Durchschnitt:
59.942
Minimum:
51.418
1 Jan 2001 Jahr
Maximum:
70.543
1 Jan 2013 Jahr
Zum Datum der Beobachtung
Wert
Absolute Veränderung
Die Veränderung bezüglich dem vorherigen Wert
1 Jan 2000 Jahr
51.7
+51.7
0.0%
1 Jan 2001 Jahr
51.418
-0.282
-0.55%
1 Jan 2002 Jahr
53.038
+1.62
3.15%
1 Jan 2004 Jahr
57.472
+4.434
8.36%
1 Jan 2006 Jahr
58.039
+0.567
0.99%
1 Jan 2008 Jahr
57.706
-0.333
-0.57%
1 Jan 2009 Jahr
59.23
+1.524
2.64%
1 Jan 2010 Jahr
64.471
+5.241
8.85%
1 Jan 2011 Jahr
66.956
+2.486
3.86%
1 Jan 2012 Jahr
68.789
+1.833
2.74%
1 Jan 2013 Jahr
70.543
+1.754
2.55%
Bewertung der Länder gemäß mit laufender Statistik nach Jahren

Kommentare:

Abschicken
PremiumAbout & FeedbackVereinbarungPrivatheit
logo
© 2022 Selected Technologies LLC – Morgan Hill, California