29
/
en
AIzaSyAYiBZKx7MnpbEhh9jyipgxe19OcubqV5w
April 1, 2024
95269
Burkina Faso
BFA
true
2
1
New businesses registered (number)
2013,2012,2011,2010,2009,2008,2007
This statistics in other country:
Timeline:
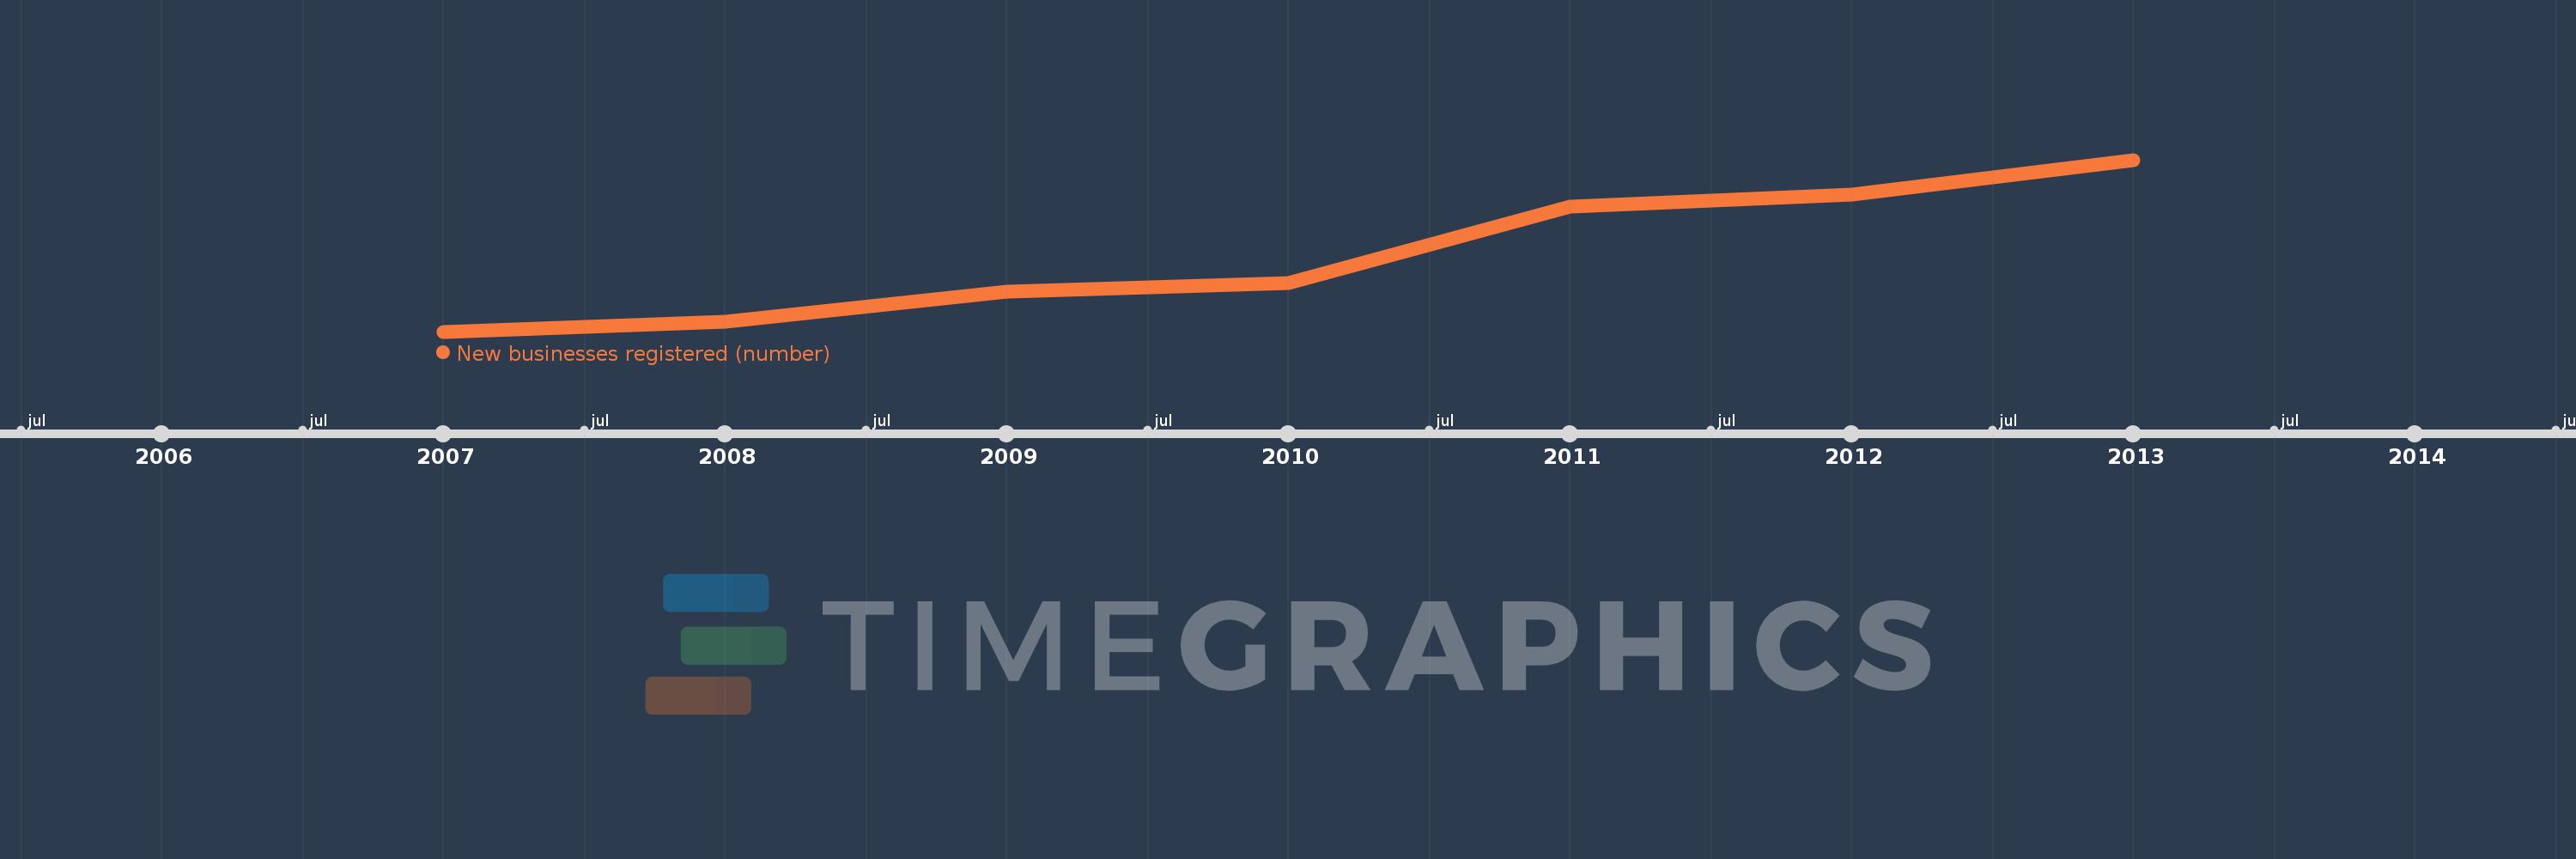
This timeline shows a graph from 2007 to 2013 of Burkina Faso. No data until 2006. Number of actual observations by date: 7.
Source name:
World Development Indicators
Source organization:
World Bank's Entrepreneurship Survey and database (http://econ.worldbank.org/research/entrepreneurship).
Categories, topics:
Private Sector
Last updated:
apr 23, 2017
Indicators value changes by year
Maximum:
1.268K
jan 1, 2013
At the date of observation
Value
Absolute change
Change from previous value
jan 1, 2007
567.0
+567.0
0.0%
jan 1, 2008
606.0
+39.0
6.88%
jan 1, 2009
730.0
+124.0
20.46%
jan 1, 2010
766.0
+36.0
4.93%
jan 1, 2011
1.076K
+310.0
40.47%
jan 1, 2012
1.127K
+51.0
4.74%
jan 1, 2013
1.268K
+141.0
12.51%
Ranking of countries by current statistics by years


Comments: