29
/
en
AIzaSyAYiBZKx7MnpbEhh9jyipgxe19OcubqV5w
April 1, 2024
274013
Ukraine
UKR
true
2
1
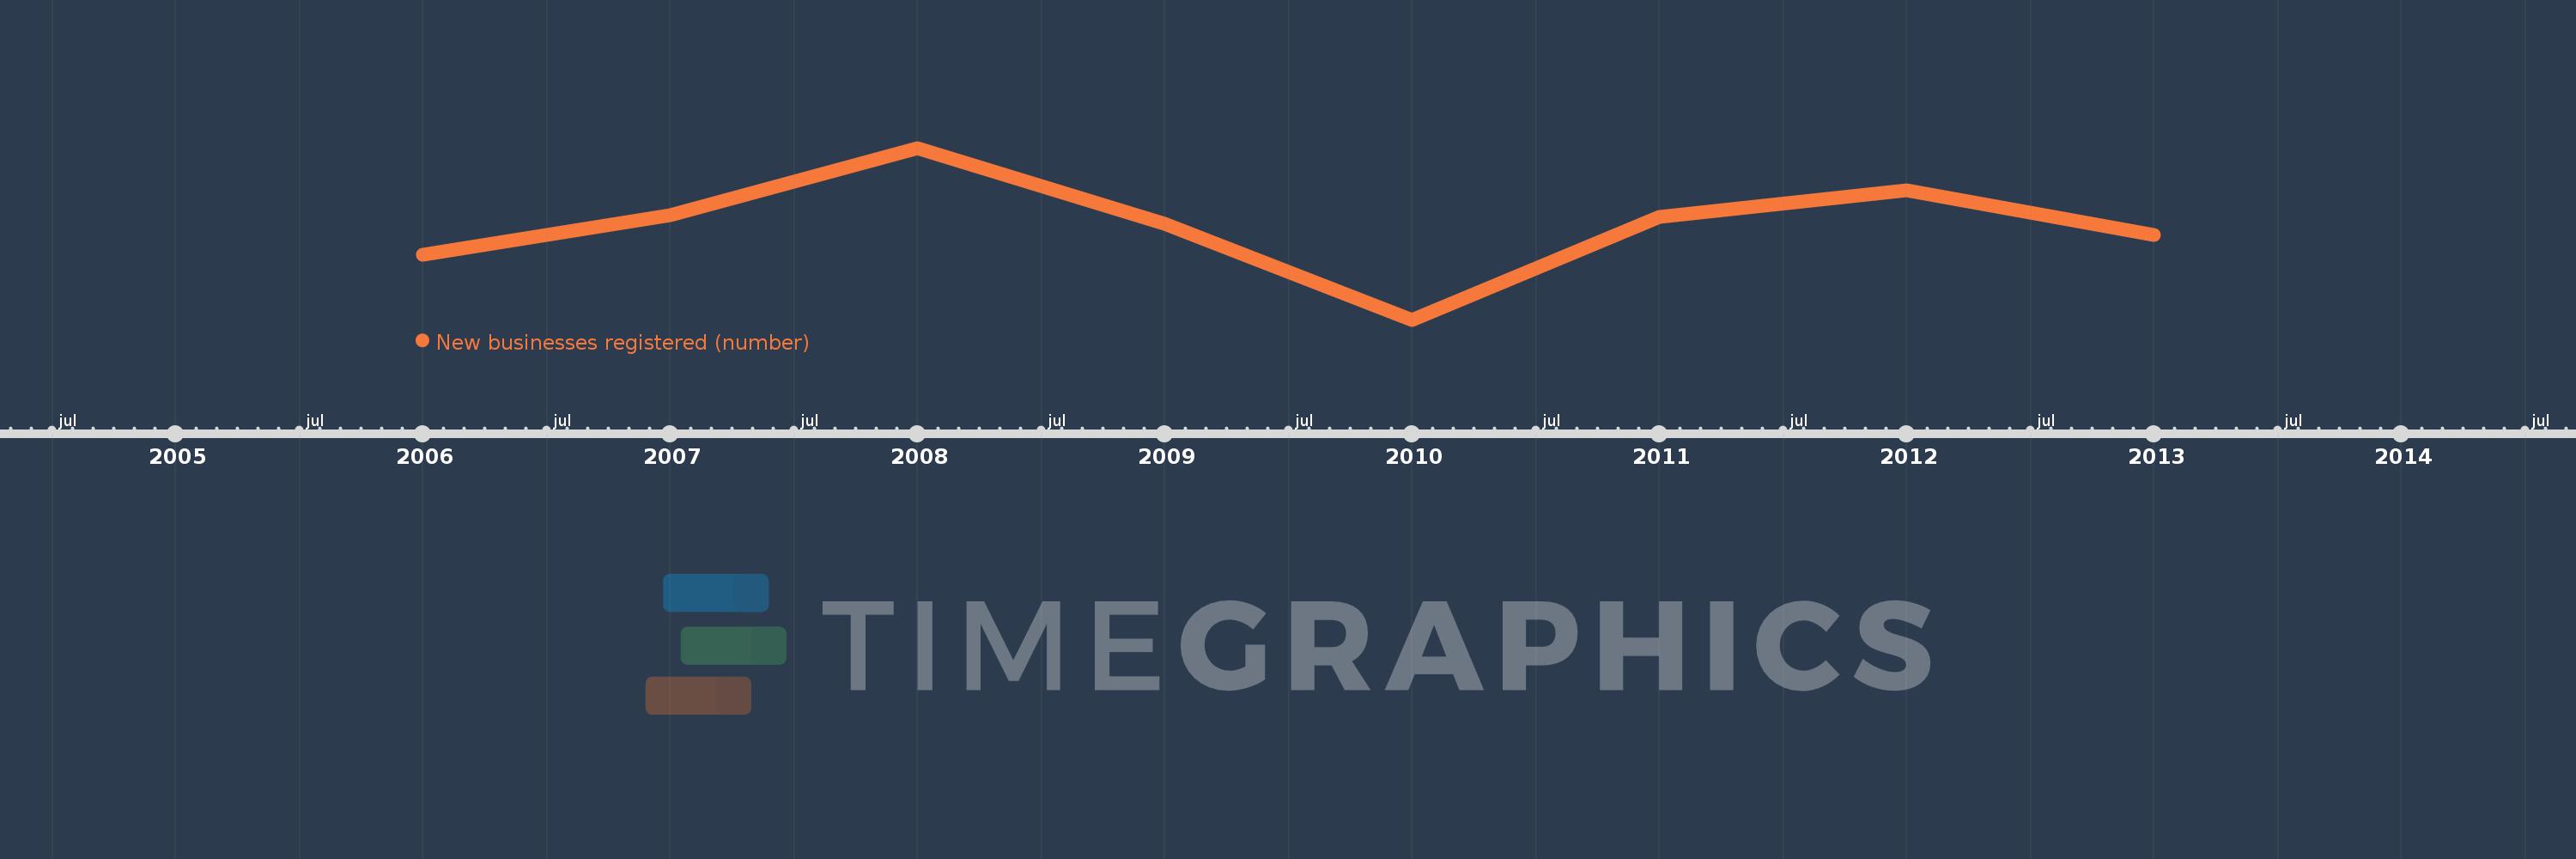
New businesses registered (number)
2013,2012,2011,2010,2009,2008,2007,2006
This statistics in other country:
Timeline:
This timeline shows a graph from 2006 to 2013 of Ukraine. No data until 2005. Number of actual observations by date: 8.
Source name:
World Development Indicators
Source organization:
World Bank's Entrepreneurship Survey and database (http://econ.worldbank.org/research/entrepreneurship).
Categories, topics:
Private Sector
Last updated:
apr 23, 2017
Indicators value changes by year
Minimum:
21.12K
jan 1, 2010
Maximum:
38.373K
jan 1, 2008
At the date of observation
Value
Absolute change
Change from previous value
jan 1, 2006
27.659K
+27.659K
0.0%
jan 1, 2007
31.611K
+3.952K
14.29%
jan 1, 2008
38.373K
+6.762K
21.39%
jan 1, 2009
30.762K
-7.611K
-19.83%
jan 1, 2010
21.12K
-9.642K
-31.34%
jan 1, 2011
31.433K
+10.313K
48.83%
jan 1, 2012
34.135K
+2.702K
8.6%
jan 1, 2013
29.65K
-4.485K
-13.14%
Ranking of countries by current statistics by years


Comments: