29
/
en
AIzaSyAYiBZKx7MnpbEhh9jyipgxe19OcubqV5w
April 1, 2024
73288
Australia
AUS
true
2
1
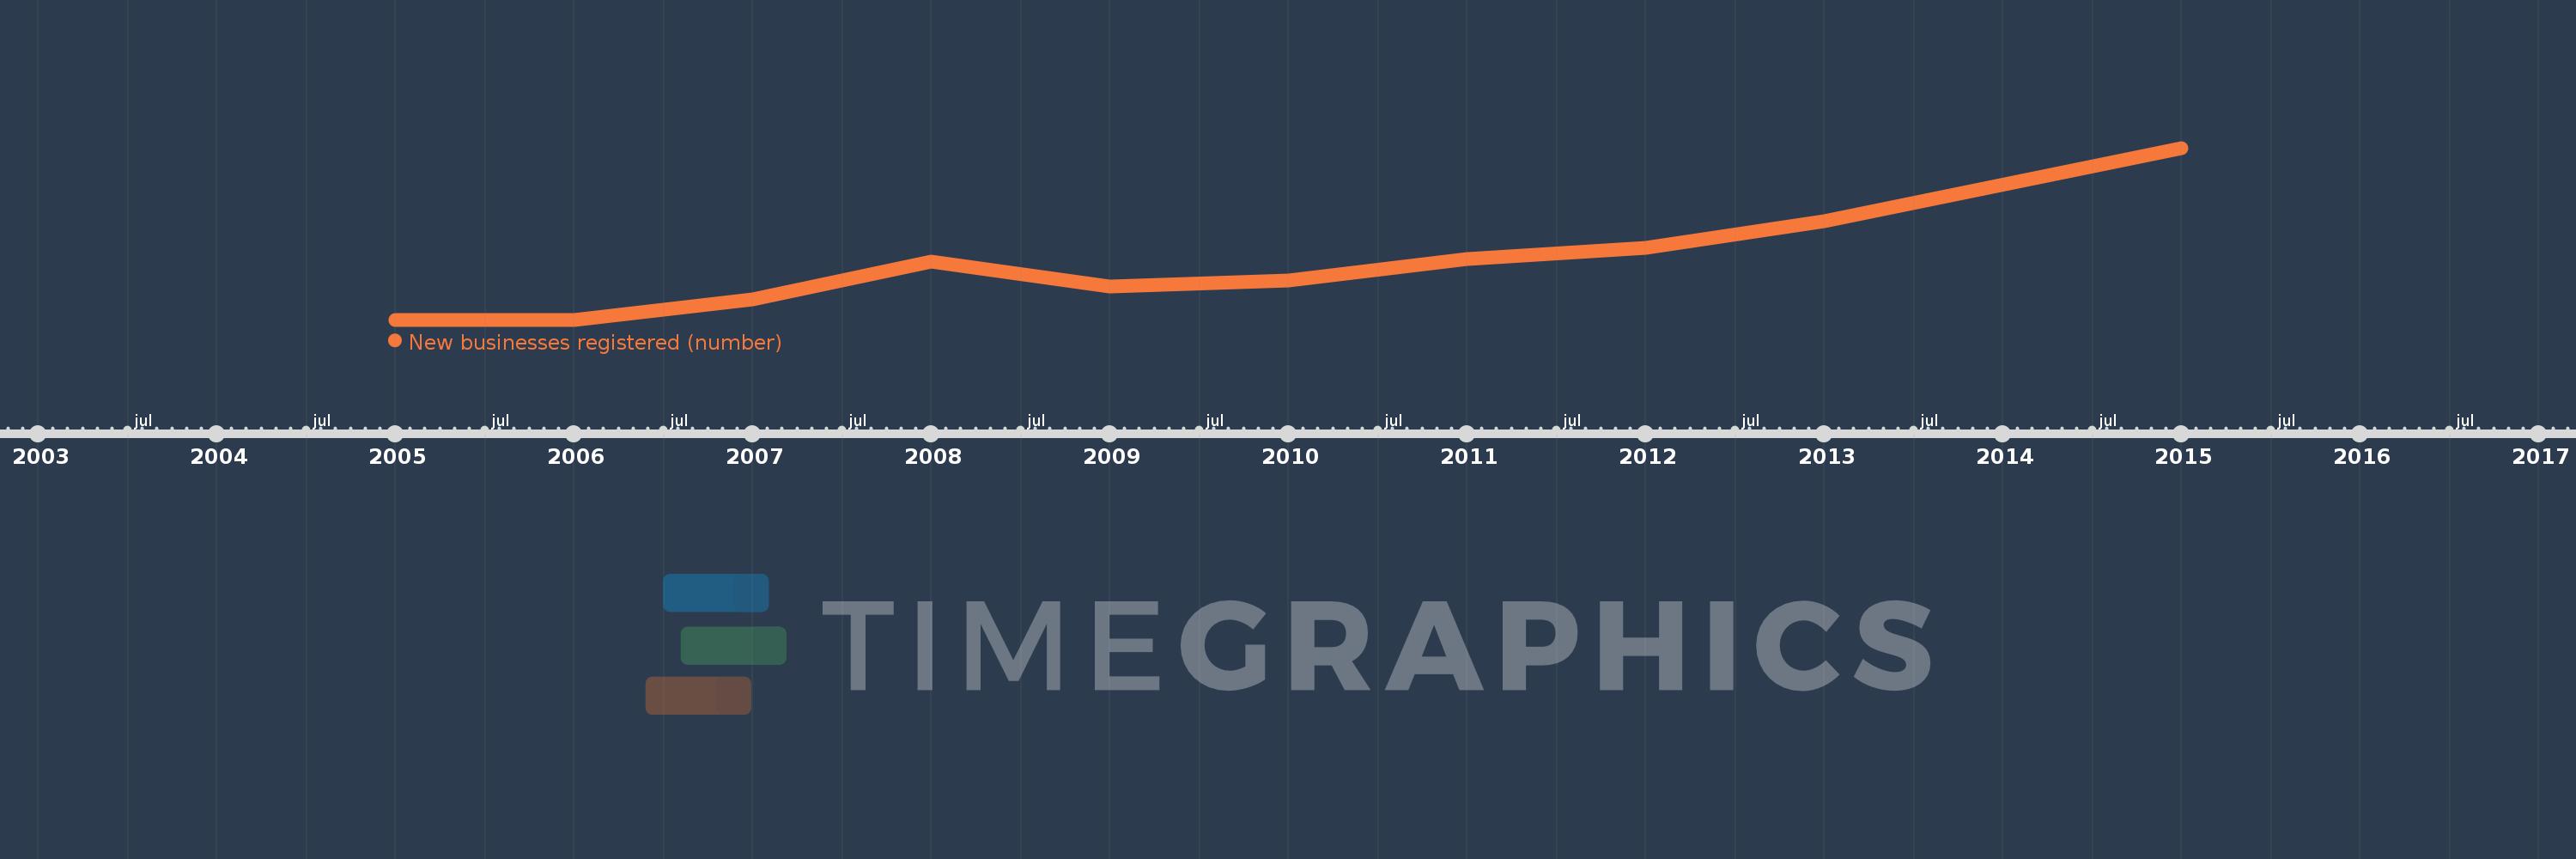
New businesses registered (number)
2015,2013,2012,2011,2010,2009,2008,2007,2006,2005
This statistics in other country:
Timeline:
This timeline shows a graph from 2005 to 2015 of Australia. No data until 2004. Number of actual observations by date: 10.
Source name:
World Development Indicators
Source organization:
World Bank's Entrepreneurship Survey and database (http://econ.worldbank.org/research/entrepreneurship).
Categories, topics:
Private Sector
Last updated:
apr 23, 2017
Indicators value changes by year
Minimum:
121.986K
jan 1, 2005
Maximum:
231.92K
jan 1, 2015
At the date of observation
Value
Absolute change
Change from previous value
jan 1, 2005
121.986K
+121.986K
0.0%
jan 1, 2006
121.994K
+8.0
0.01%
jan 1, 2007
135.092K
+13.098K
10.74%
jan 1, 2008
159.108K
+24.016K
17.78%
jan 1, 2009
143.153K
-15.955K
-10.03%
jan 1, 2010
147.258K
+4.105K
2.87%
jan 1, 2011
160.615K
+13.357K
9.07%
jan 1, 2012
168.17K
+7.555K
4.7%
jan 1, 2013
185.009K
+16.839K
10.01%
jan 1, 2015
231.92K
+46.911K
25.36%
Ranking of countries by current statistics by years


Comments: