29
/
en
AIzaSyAYiBZKx7MnpbEhh9jyipgxe19OcubqV5w
April 1, 2024
194658
Mauritius
MUS
true
2
1
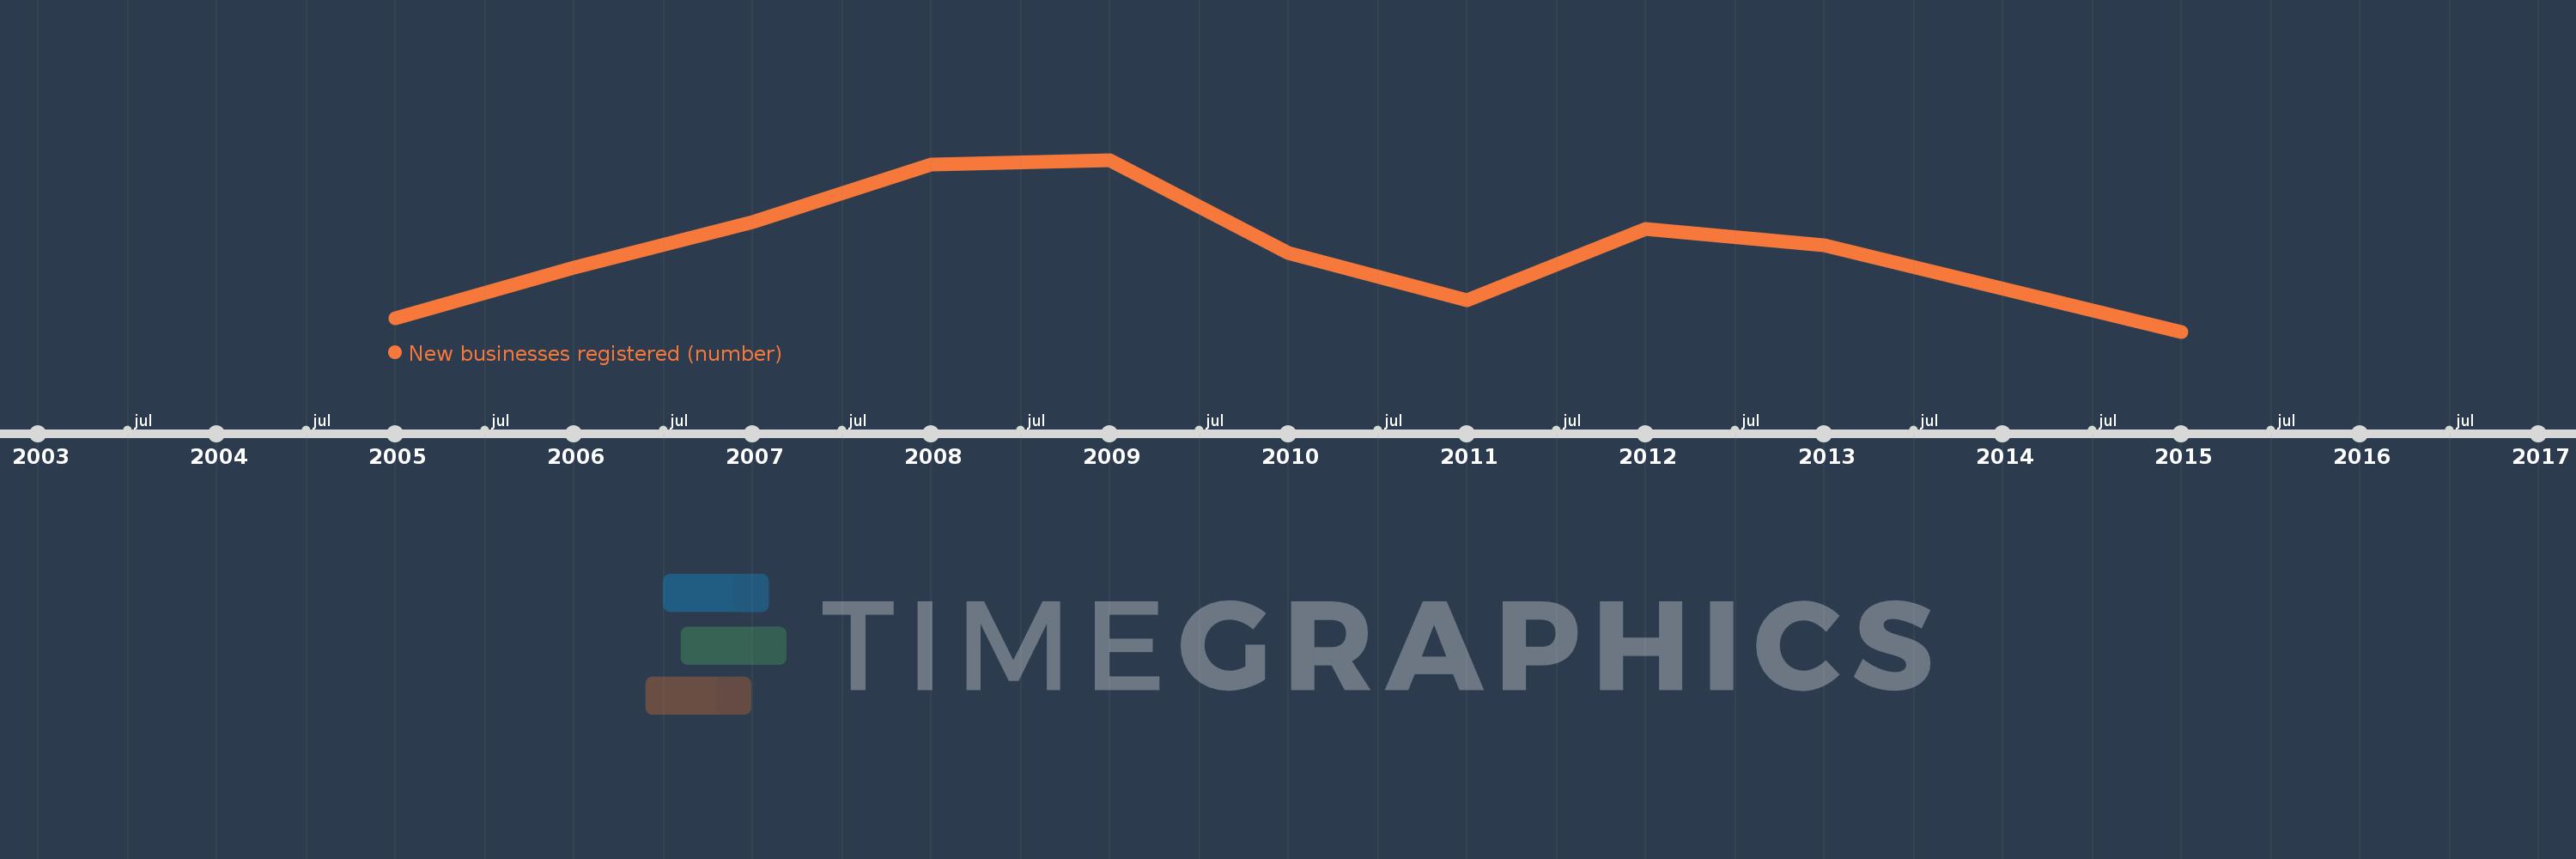
New businesses registered (number)
2015,2013,2012,2011,2010,2009,2008,2007,2006,2005
This statistics in other country:
Timeline:
This timeline shows a graph from 2005 to 2015 of Mauritius. No data until 2004. Number of actual observations by date: 10.
Source name:
World Development Indicators
Source organization:
World Bank's Entrepreneurship Survey and database (http://econ.worldbank.org/research/entrepreneurship).
Categories, topics:
Private Sector
Last updated:
apr 23, 2017
Indicators value changes by year
Minimum:
4.633K
jan 1, 2015
Maximum:
9.012K
jan 1, 2009
At the date of observation
Value
Absolute change
Change from previous value
jan 1, 2005
4.976K
+4.976K
0.0%
jan 1, 2006
6.26K
+1.284K
25.8%
jan 1, 2007
7.435K
+1.175K
18.77%
jan 1, 2008
8.888K
+1.453K
19.54%
jan 1, 2009
9.012K
+124.0
1.4%
jan 1, 2010
6.631K
-2.381K
-26.42%
jan 1, 2011
5.442K
-1.189K
-17.93%
jan 1, 2012
7.239K
+1.797K
33.02%
jan 1, 2013
6.825K
-414.0
-5.72%
jan 1, 2015
4.633K
-2.192K
-32.12%
Ranking of countries by current statistics by years


Comments: