29
/
en
AIzaSyAYiBZKx7MnpbEhh9jyipgxe19OcubqV5w
April 1, 2024
262685
Thailand
THA
true
2
1
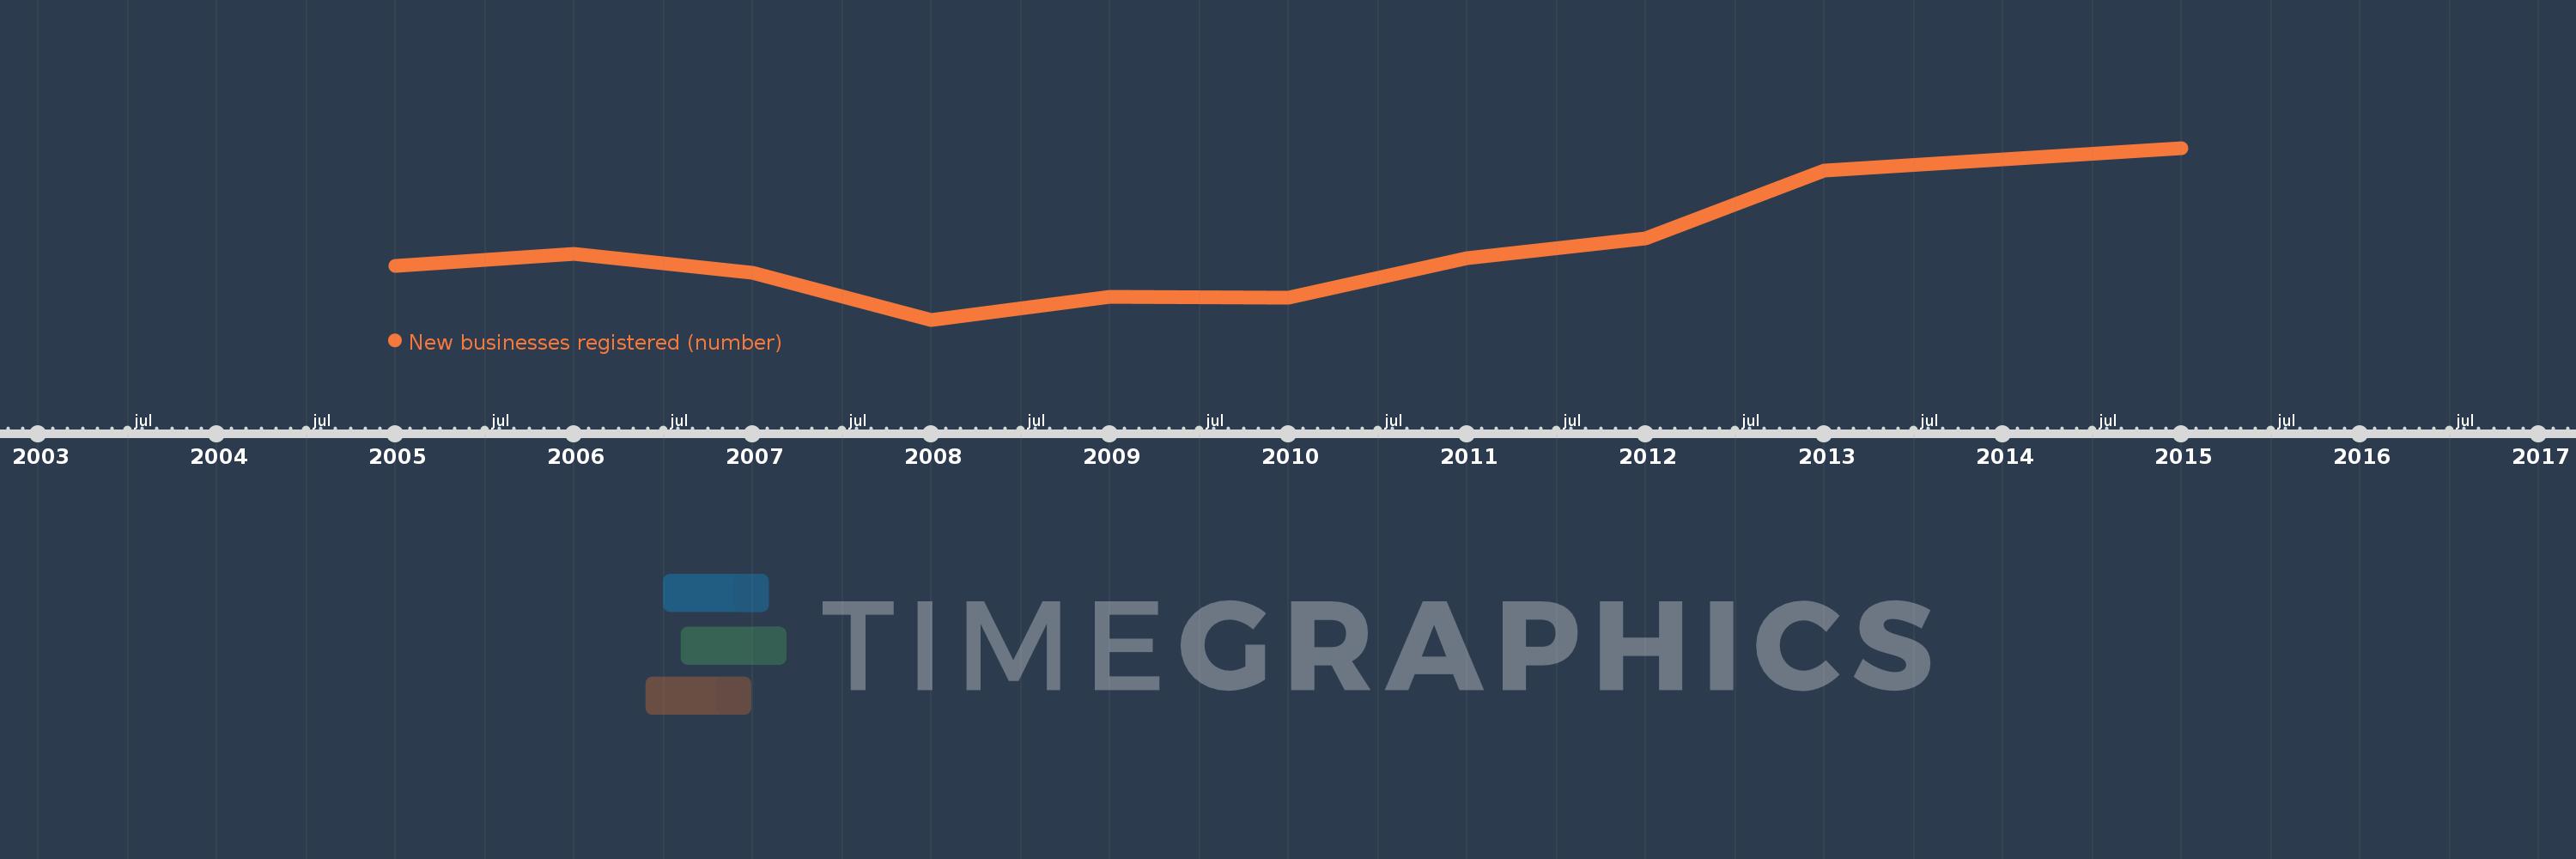
New businesses registered (number)
2015,2013,2012,2011,2010,2009,2008,2007,2006,2005
This statistics in other country:
Timeline:
This timeline shows a graph from 2005 to 2015 of Thailand. No data until 2004. Number of actual observations by date: 10.
Source name:
World Development Indicators
Source organization:
World Bank's Entrepreneurship Survey and database (http://econ.worldbank.org/research/entrepreneurship).
Categories, topics:
Private Sector
Last updated:
apr 23, 2017
Indicators value changes by year
Minimum:
25.241K
jan 1, 2008
Maximum:
43.589K
jan 1, 2015
At the date of observation
Value
Absolute change
Change from previous value
jan 1, 2005
31.037K
+31.037K
0.0%
jan 1, 2006
32.243K
+1.206K
3.89%
jan 1, 2007
30.235K
-2.008K
-6.23%
jan 1, 2008
25.241K
-4.994K
-16.52%
jan 1, 2009
27.68K
+2.439K
9.66%
jan 1, 2010
27.587K
-93.0
-0.34%
jan 1, 2011
31.806K
+4.219K
15.29%
jan 1, 2012
33.94K
+2.134K
6.71%
jan 1, 2013
41.21K
+7.27K
21.42%
jan 1, 2015
43.589K
+2.379K
5.77%
Ranking of countries by current statistics by years


Comments: