29
/
en
AIzaSyAYiBZKx7MnpbEhh9jyipgxe19OcubqV5w
April 1, 2024
224005
Philippines
PHL
true
2
1
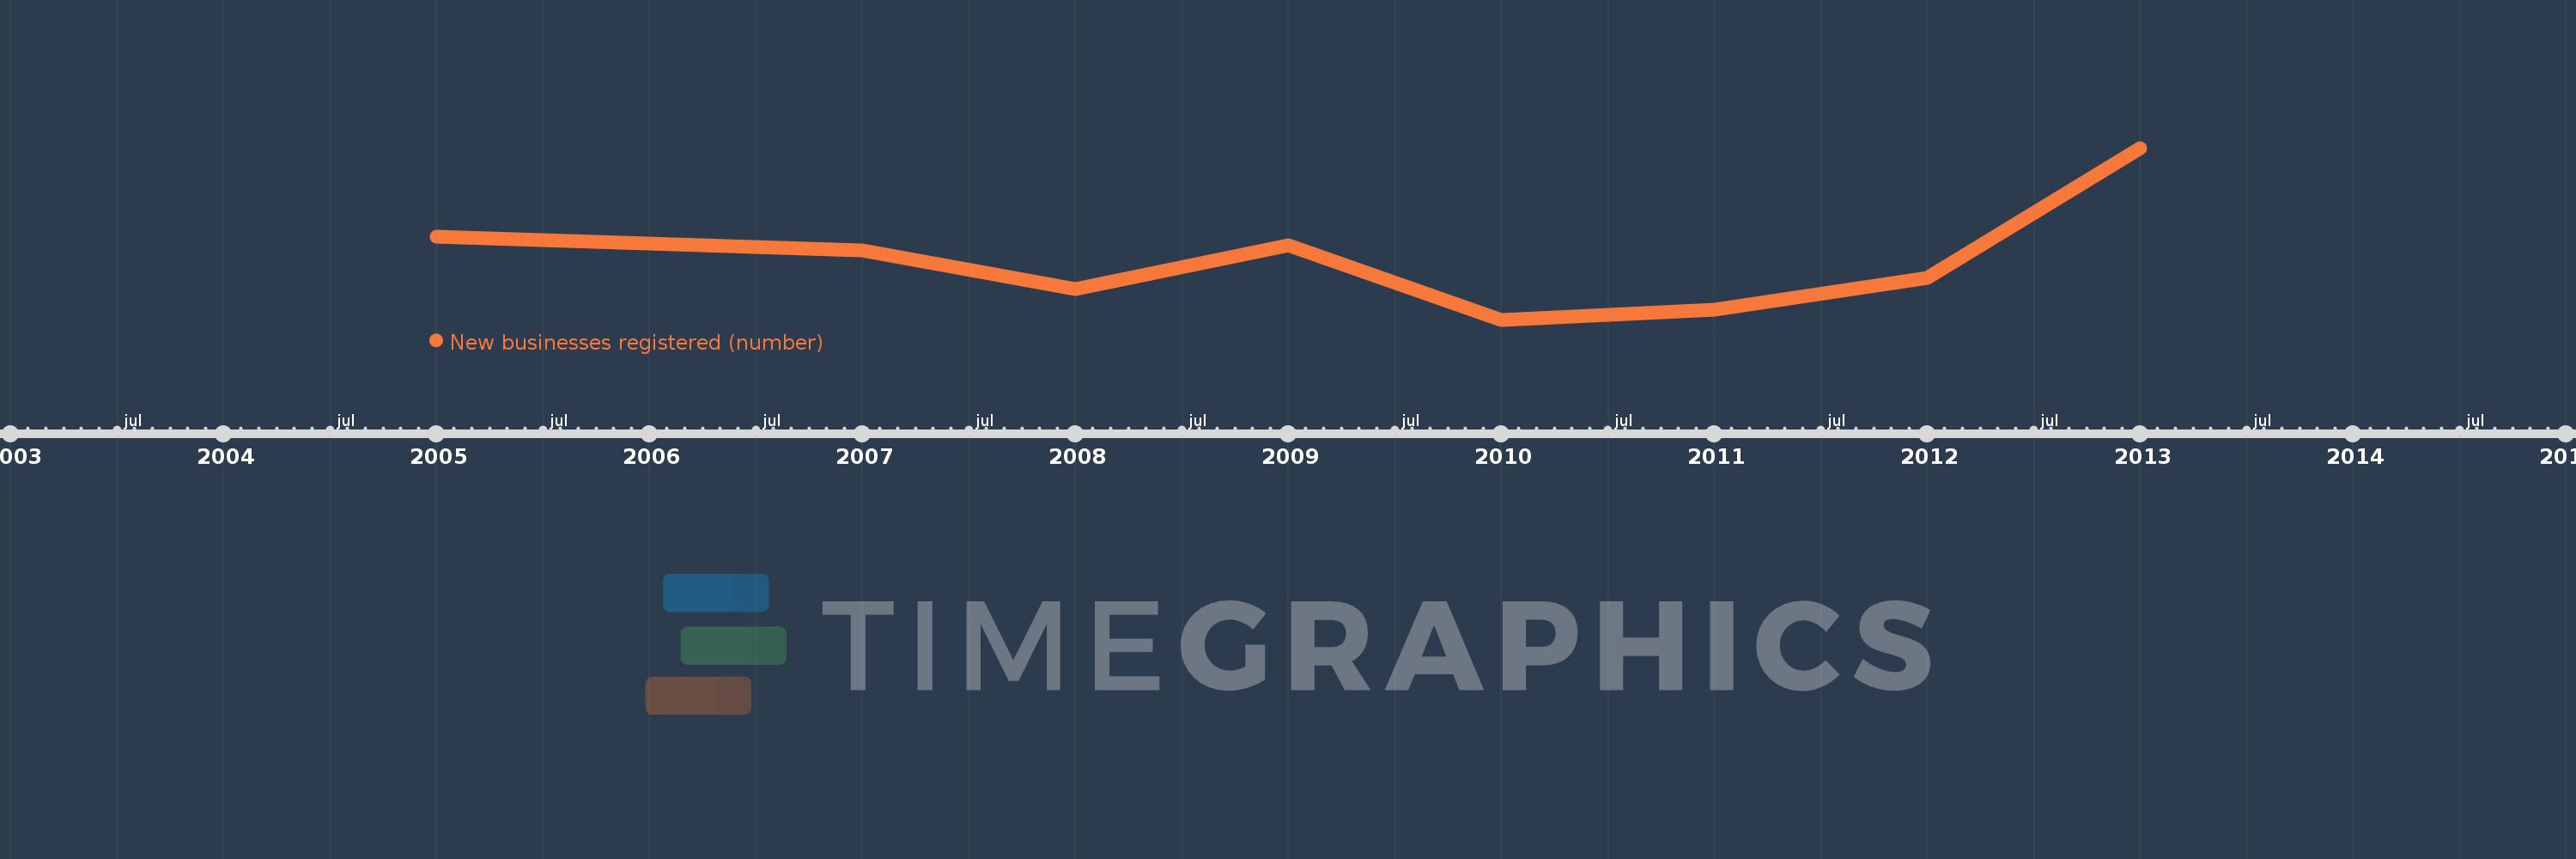
New businesses registered (number)
2013,2012,2011,2010,2009,2008,2007,2006,2005
This statistics in other country:
Timeline:
This timeline shows a graph from 2005 to 2013 of Philippines. No data until 2004. Number of actual observations by date: 9.
Source name:
World Development Indicators
Source organization:
World Bank's Entrepreneurship Survey and database (http://econ.worldbank.org/research/entrepreneurship).
Categories, topics:
Private Sector
Last updated:
apr 23, 2017
Indicators value changes by year
Minimum:
11.435K
jan 1, 2010
Maximum:
16.143K
jan 1, 2013
At the date of observation
Value
Absolute change
Change from previous value
jan 1, 2005
13.714K
+13.714K
0.0%
jan 1, 2006
13.523K
-191.0
-1.39%
jan 1, 2007
13.325K
-198.0
-1.46%
jan 1, 2008
12.285K
-1.04K
-7.8%
jan 1, 2009
13.47K
+1.185K
9.65%
jan 1, 2010
11.435K
-2.035K
-15.11%
jan 1, 2011
11.714K
+279.0
2.44%
jan 1, 2012
12.59K
+876.0
7.48%
jan 1, 2013
16.143K
+3.553K
28.22%
Ranking of countries by current statistics by years


Comments: