29
/
en
AIzaSyAYiBZKx7MnpbEhh9jyipgxe19OcubqV5w
April 1, 2024
74229
Austria
AUT
true
2
1
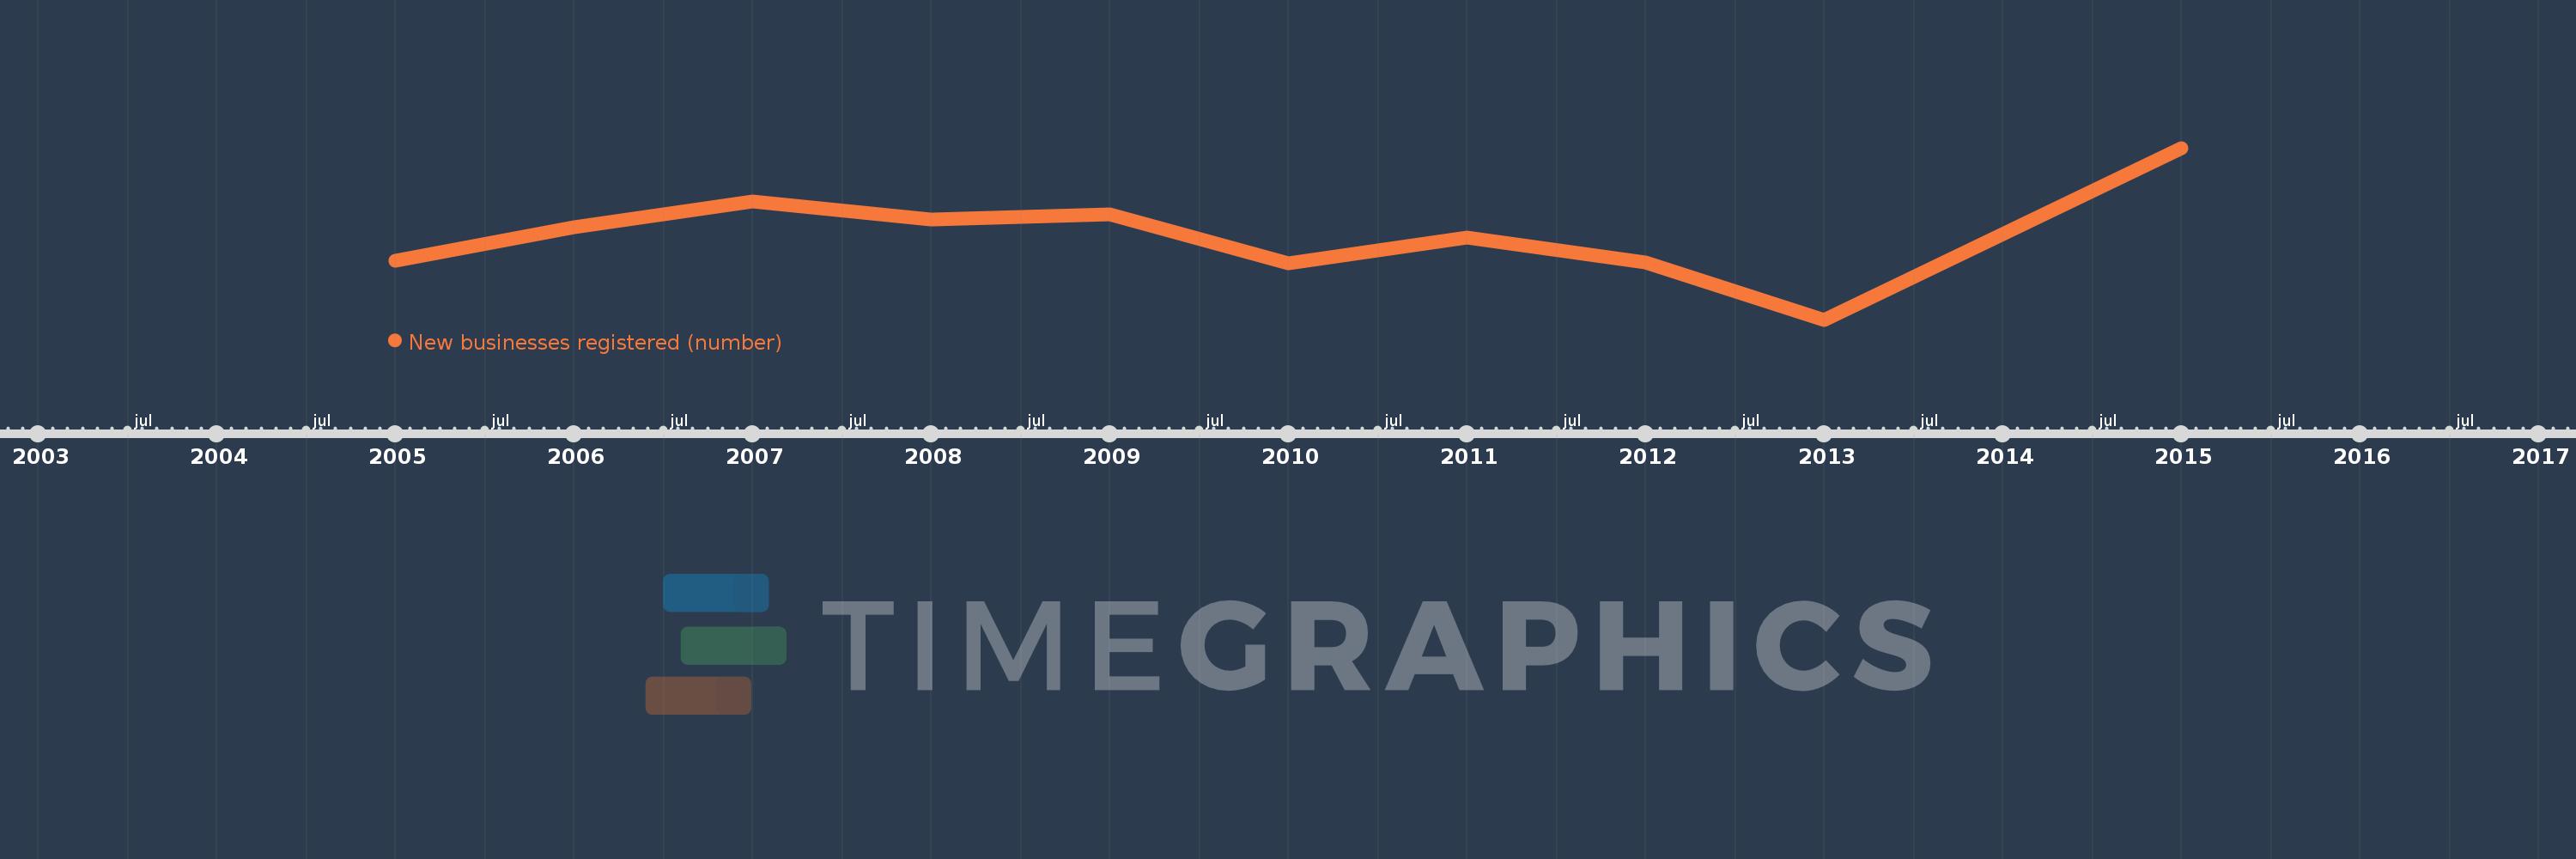
New businesses registered (number)
2015,2013,2012,2011,2010,2009,2008,2007,2006,2005
This statistics in other country:
Timeline:
This timeline shows a graph from 2005 to 2015 of Austria. No data until 2004. Number of actual observations by date: 10.
Source name:
World Development Indicators
Source organization:
World Bank's Entrepreneurship Survey and database (http://econ.worldbank.org/research/entrepreneurship).
Categories, topics:
Private Sector
Last updated:
apr 23, 2017
Indicators value changes by year
Minimum:
2.834K
jan 1, 2013
Maximum:
4.181K
jan 1, 2015
At the date of observation
Value
Absolute change
Change from previous value
jan 1, 2005
3.294K
+3.294K
0.0%
jan 1, 2006
3.561K
+267.0
8.11%
jan 1, 2007
3.759K
+198.0
5.56%
jan 1, 2008
3.622K
-137.0
-3.64%
jan 1, 2009
3.663K
+41.0
1.13%
jan 1, 2010
3.274K
-389.0
-10.62%
jan 1, 2011
3.476K
+202.0
6.17%
jan 1, 2012
3.285K
-191.0
-5.49%
jan 1, 2013
2.834K
-451.0
-13.73%
jan 1, 2015
4.181K
+1.347K
47.53%
Ranking of countries by current statistics by years


Comments: