29
/
en
AIzaSyAYiBZKx7MnpbEhh9jyipgxe19OcubqV5w
April 1, 2024
93967
Bulgaria
BGR
true
2
1
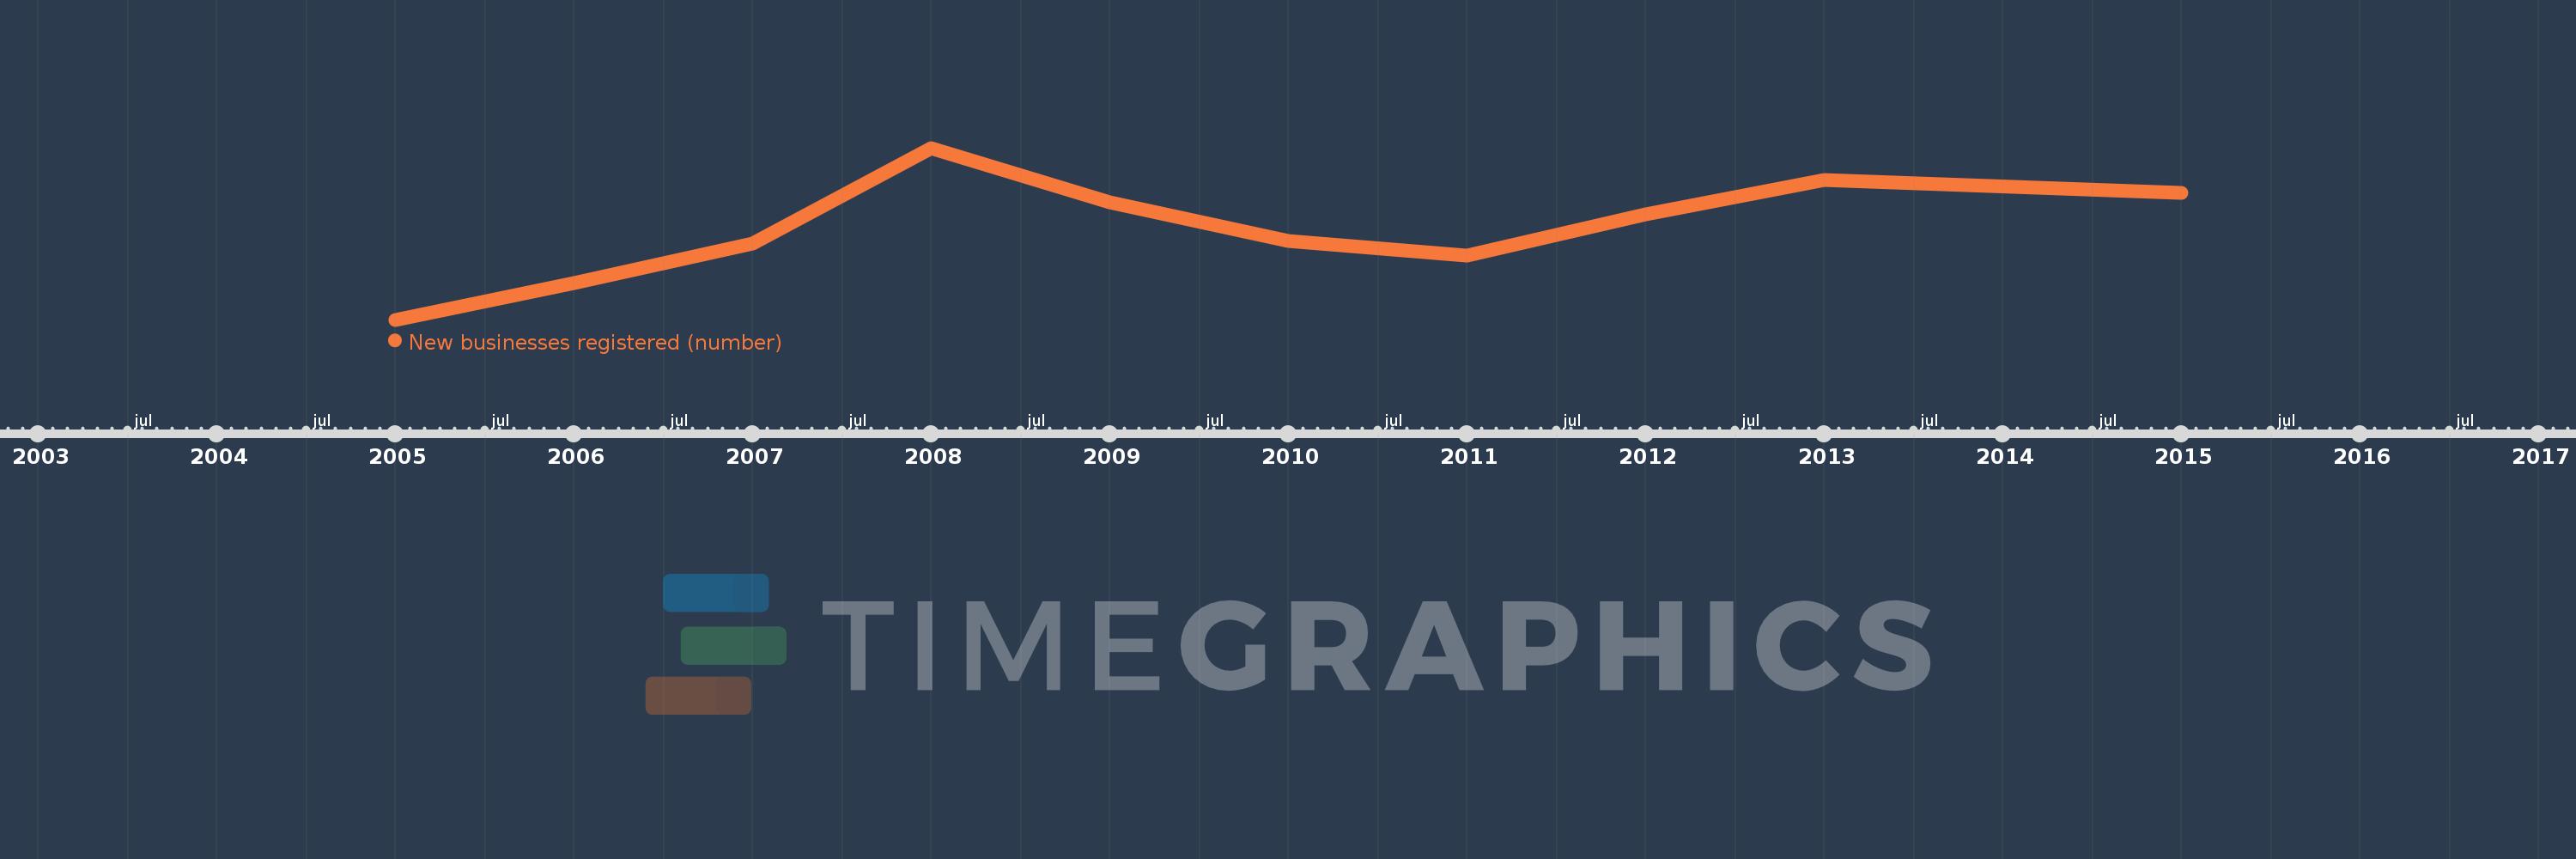
New businesses registered (number)
2015,2013,2012,2011,2010,2009,2008,2007,2006,2005
This statistics in other country:
Timeline:
This timeline shows a graph from 2005 to 2015 of Bulgaria. No data until 2004. Number of actual observations by date: 10.
Source name:
World Development Indicators
Source organization:
World Bank's Entrepreneurship Survey and database (http://econ.worldbank.org/research/entrepreneurship).
Categories, topics:
Private Sector
Last updated:
apr 23, 2017
Indicators value changes by year
Minimum:
23.838K
jan 1, 2005
Maximum:
49.328K
jan 1, 2008
At the date of observation
Value
Absolute change
Change from previous value
jan 1, 2005
23.838K
+23.838K
0.0%
jan 1, 2006
29.338K
+5.5K
23.07%
jan 1, 2007
35.098K
+5.76K
19.63%
jan 1, 2008
49.328K
+14.23K
40.54%
jan 1, 2009
41.218K
-8.11K
-16.44%
jan 1, 2010
35.57K
-5.648K
-13.7%
jan 1, 2011
33.3K
-2.27K
-6.38%
jan 1, 2012
39.476K
+6.176K
18.55%
jan 1, 2013
44.537K
+5.061K
12.82%
jan 1, 2015
42.613K
-1.924K
-4.32%
Ranking of countries by current statistics by years


Comments: